Overview
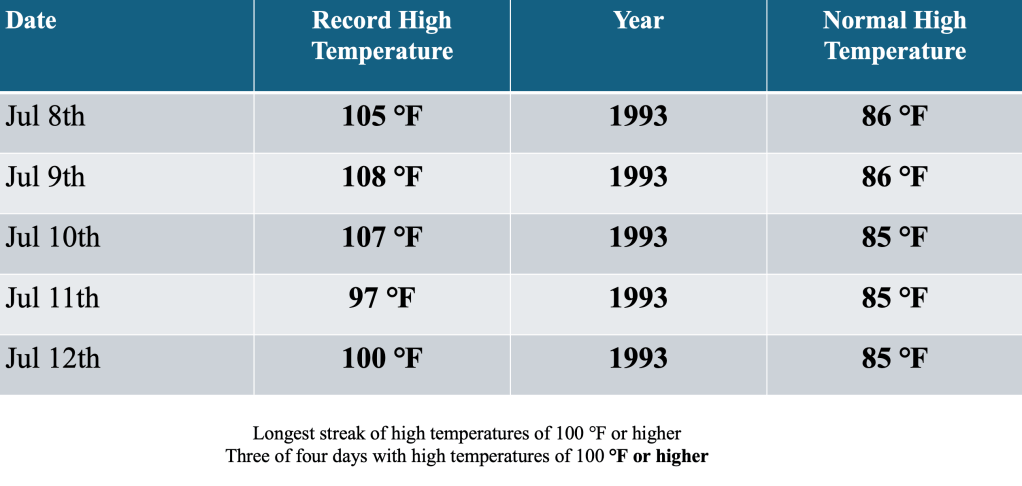
During a five day stretch in July of 1993, the Bellcrest section of Toms River, NJ endured its hottest stretch on record (temperature records extend back to 1978). High temperatures on four of the five days topped out at 100 degrees or higher, the only time this has happened at this location. In fact, the highest temperature ever observed at the station (108 degrees F) happened during this period. High temperatures of 100 degrees of higher are relatively rare on the Jersey Shore, due mainly to the proximity of the cooler ocean, which often sends a sea breeze across the coast during the hottest times of the year.
How Often Does the Temperature Reach 100 degrees on the Jersey Shore?
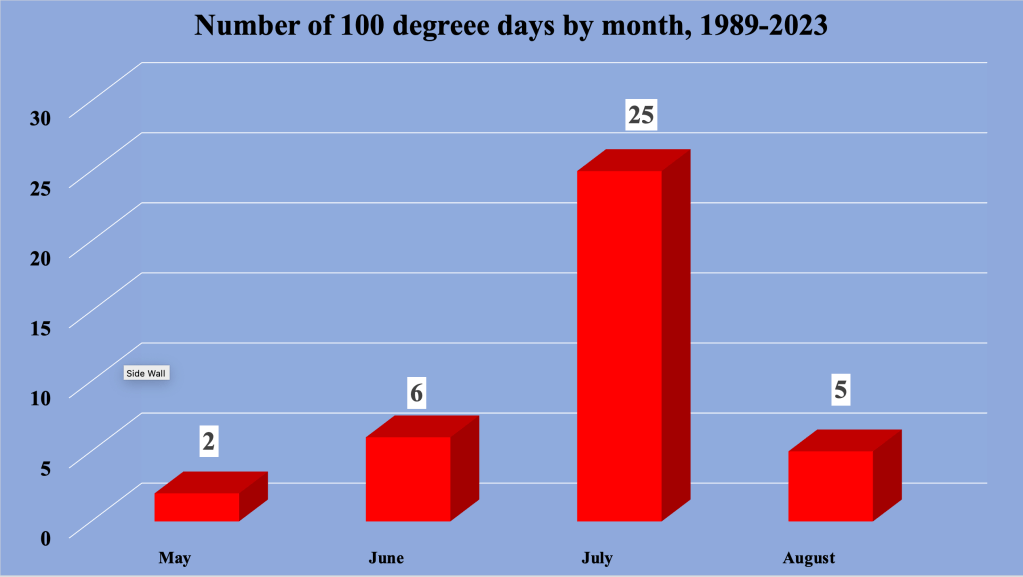
Just how often do high temperatures equal or exceed the 100 degree mark along the Jersey Shore? During the period 1989-2023, high temperatures of 100 degrees or higher occurred 38 times, or about once a year. However, this statistic can be misleading, as 100 degree days do not often happen as a singular event; instead, they can occur in pairs, distorting the average to some degree.
Of course, to reach 100 degrees at the Jersey Shore, the opposing flow (the surface wind that tends to blow offshore) must be strong enough to fend off the ubiquitous sea breeze, which develops during most summer days. If the sea breeze develops, there is little chance coastal sections will reach 100 degrees while just miles from the beach, temperatures can reach that mark. To reach 100 degrees at the shore, the southwest winds at the surface need to be strong than 10 mph, rotating counter clockwise around high pressure centered off the Mid Atlantic coast.

Figure 2 A conceptual model of what the surface map looks like when high temperatures reach 100 degrees along the Jersey Shore.
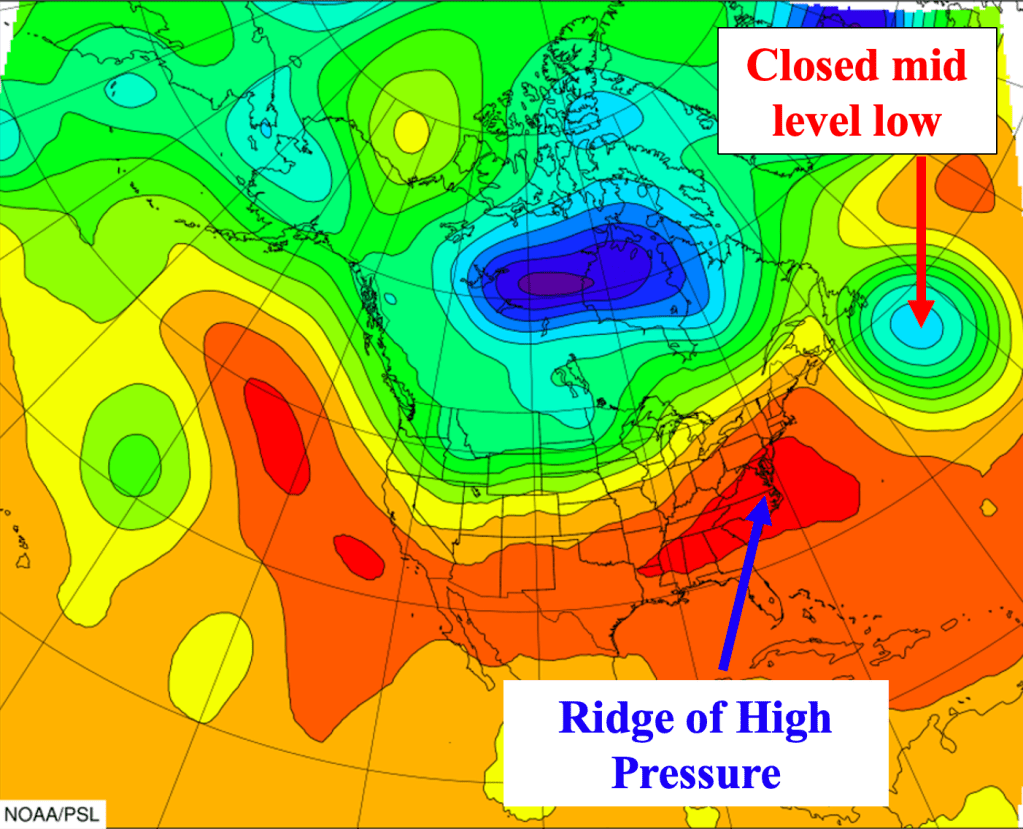
Often referred to as Bermuda Highs, these high pressure systems develop a few times a summer, leading to hot conditions along the East Coast. So what makes a Bermuda High capable of producing 100 degree days, if they can develop a few times a summer? The key is support of high pressure in the mid levels of the atmosphere as well. Developing high pressure in the mid levels off the Mid Atlantic Coast allows air to descend and dry (known as adiabatic warming) as it sinks from the mid levels of the atmosphere to the surface.
As air sinks in the atmosphere, it gets warmer and dries out, allowing the temperatures to get hotter than if the mid level system was not in place. In general, 100 degree days along the Jersey Shore need to be drier than the typical summer day. When the air is humid, the moisture in the air needs to be warmed as well as the air itself, which takes more energy. If the air is already dry, more warming foes into making the dry air hotter, which is how 100 degree temperatures occur on the Jersey Shore.
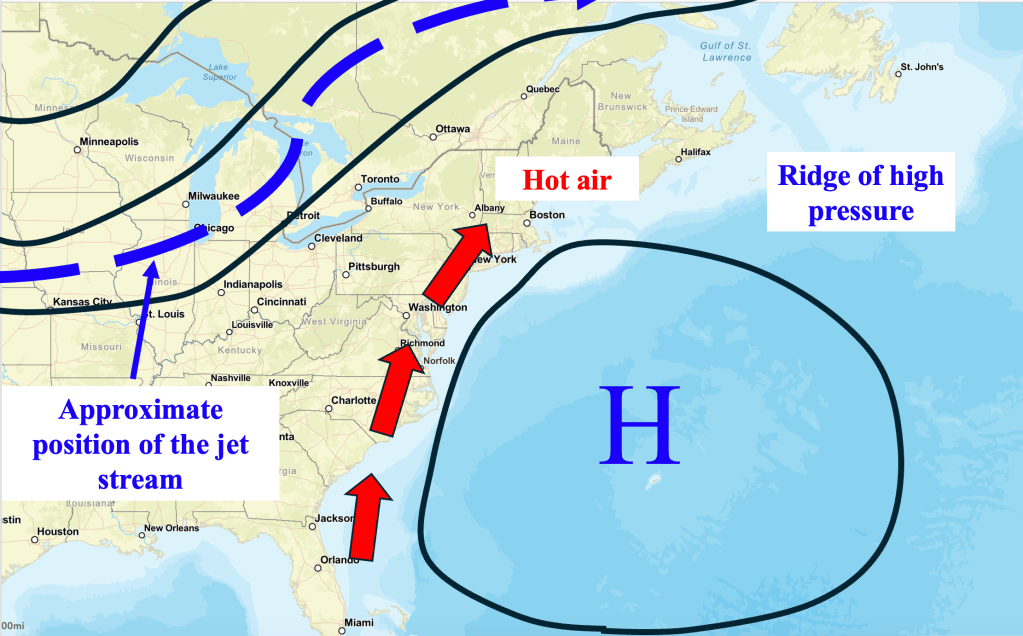
Figure 1 shows that 100 degree days have only occurred May, June, July and August in the Bellcrest section of Toms River, NJ. July has by far the largest number of 100 degrees days, as the ocean water temperature begins warming and the potential for sea breezes on any particular day to start to diminish. During most of the 100 degree days, humidity levels were lower than a typical summer day, though some of the days in July can be almost as humid.
The Scorching Heat of July 8th through 12th, 1993

By the morning of July 8th, 1993, conditions had developed to support the beginning of a hot spell for much of the Mid Atlantic And Northeast. Bermuda High pressure in position produced a strong enough opposing flow to ensure that the sea breeze would remain offshore, allowing coastal sections to heat up as much as places further inland.
In the mid levels of the atmosphere, high pressure was in place along the Mid Atlantic coast, which allowed warming and drying of the air transported into NJ as it descended into the region. This ridge of high pressure was especially strong, extending from NJ southwest to the Gulf States, held in place by a closed mid level low well southeast of Labrador Canada. Known as a blocking low, these systems become “cut off” from the main flow and tend to move slowly. As long as the blocking low was in place, the mid level ridge in place was unable to exit, extending the heat through five days.
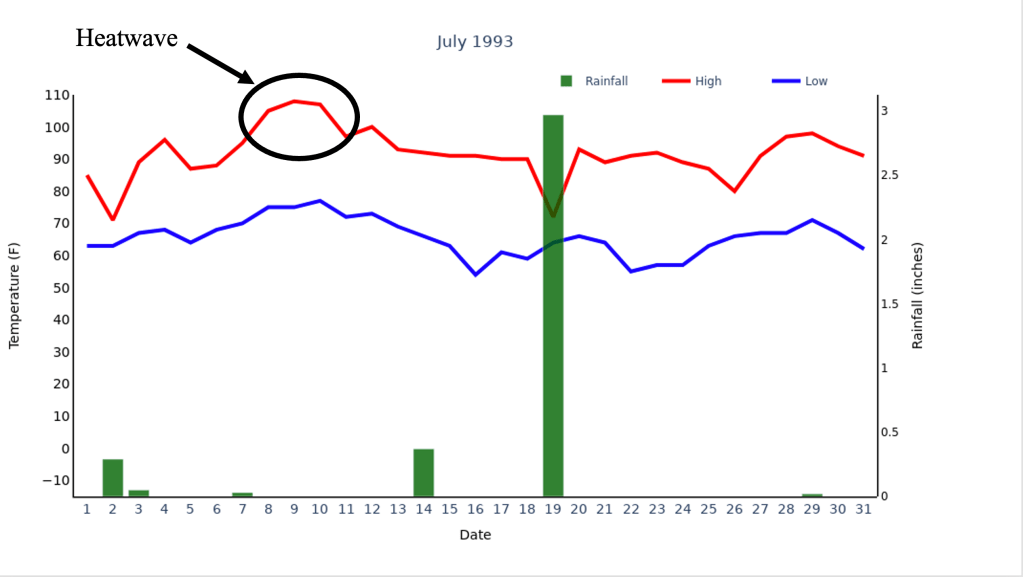
Given the persistent nature of the pattern, the heat continued nearly unabated for the next five days. An all time daily record high temperature was established on July 9th, when we topped out at 108 degrees F! A few other locations in NJ managed high temperatures near 105 F on that same date, but our station posted one of the hottest readings in central NJ. On July 10th, we just missed tying that all time record, with a 107 F high temperature logged. For many locations in NJ, this was the hottest day of the heatwave.
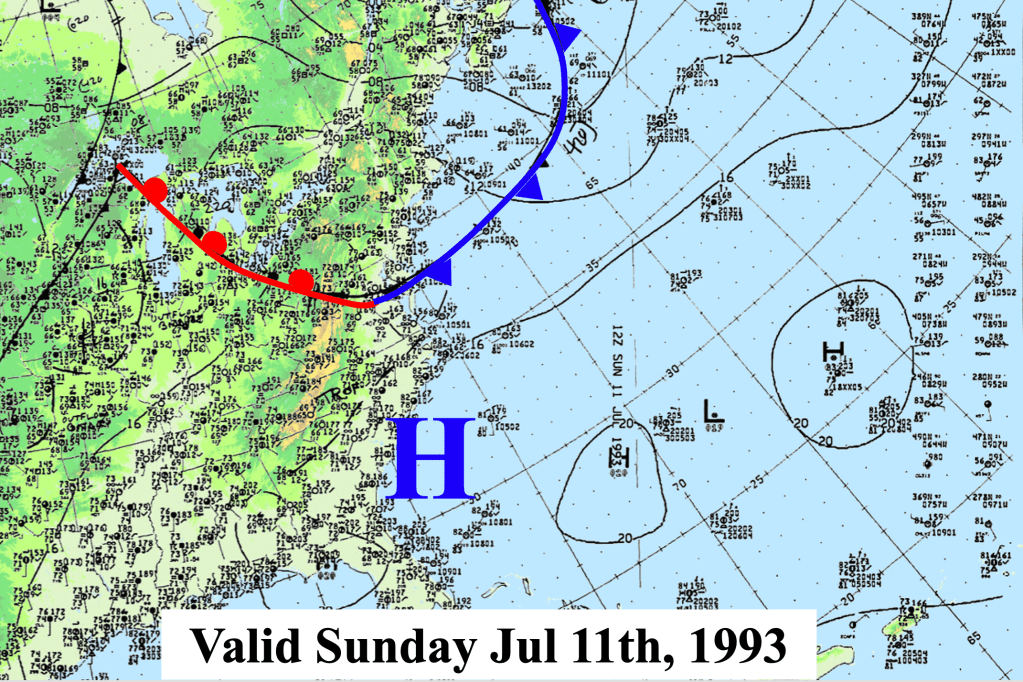
Figure 6 Surface analysis for Sunday, July 11, 1993. Note that a shallow cold front dropped south across NJ, allowing slightly cooler temperatures to cover much of the Jersey Shore.
A cold front dropping south across NJ allowed slightly cooler air from New England to bleed southward, resulting in high temperatures in the 90s, rather than topping 100 degrees. However, the front moved back north on the 12th, allowing temperatures to reach back to 100 degrees for the final time across the Jersey Shore. A stronger cold front finally pushed the heat back into the Atlantic Ocean, dropping temperatures back into the 90s, more reminiscent of summer days at the shore.
In the Aftermath of the Heatwave
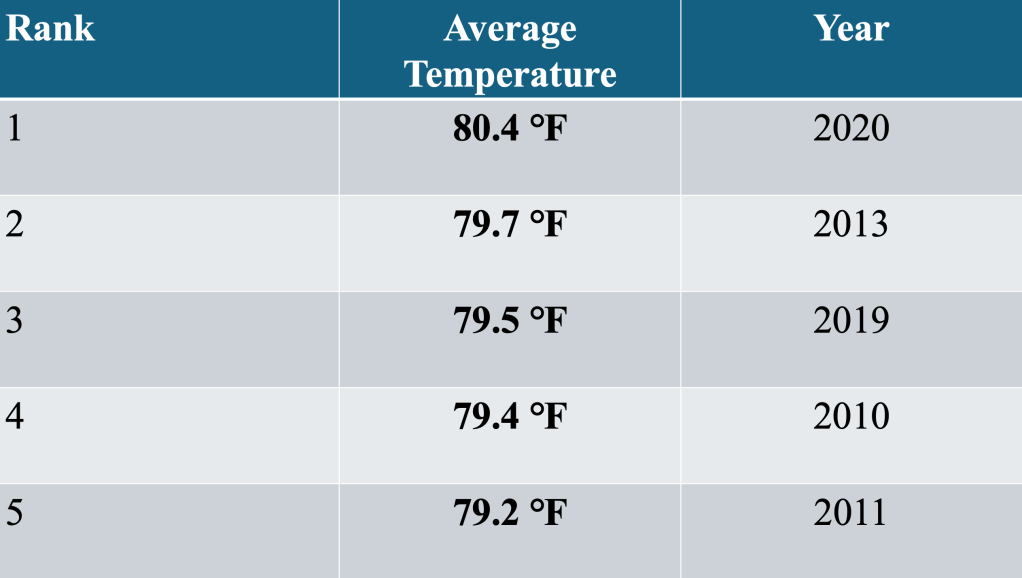
Though temperatures for the remainder of the month averaged above normal, the month itself was NOT one of the five hottest months of July for our station. Given the length and intensity of the heatwave, it seemed assured that July 1993 would take its place as one of the warmest (if not THE warmest July ever). Surprisingly, some of the effects of the heat were mitigated by the fact that low temperatures were actually below normal for the month, which provided some mitigation of the hot days.

Leave a comment