Overview
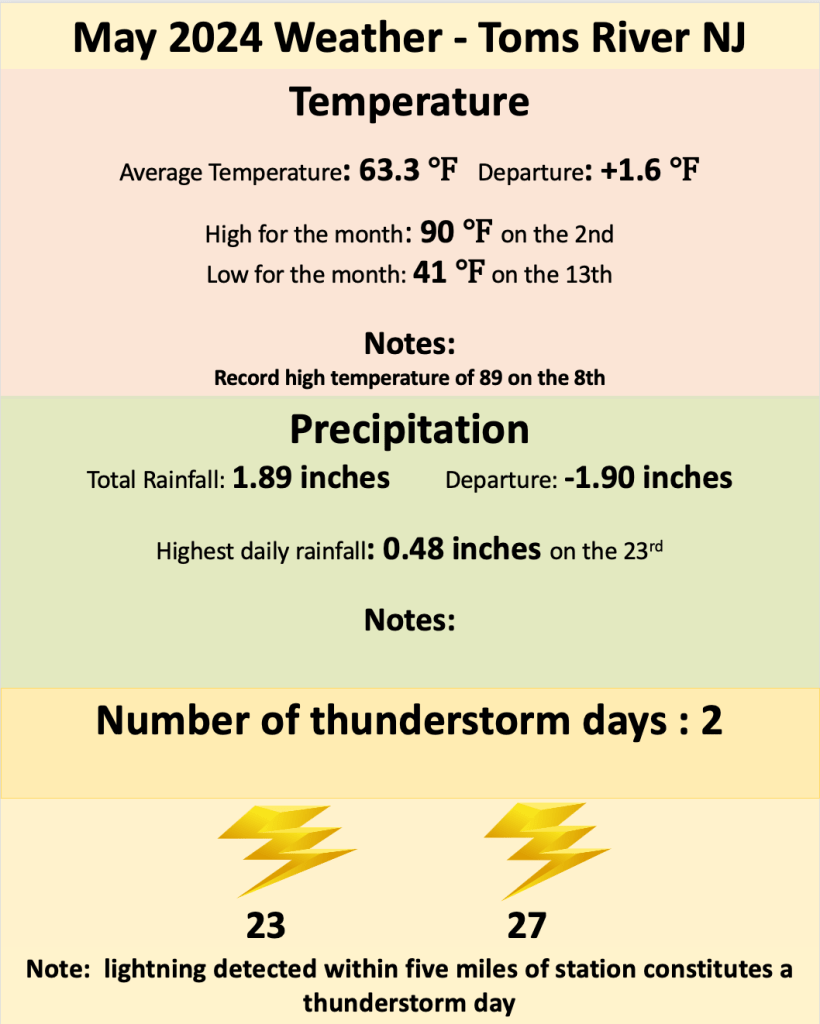
May 2024 was warmer than normal in the Bellcrest section of Toms River, NJ, and much drier than normal, despite an unusual number of rainfall events for the month. As is often the case during the spring on the Jersey Shore, there were strong variations in temperatures, with the last third of the month experiencing above normal temperatures. The warm weather was counteracted by cooler temperatures for much of the middle of the month, so for the month May averaged just above normal. Rainfall was much below normal, which is also not unusual for May, as the transition from winter rain to thunderstorms often results in lighter rainfall amounts for the month. Despite the lower rainfall amounts for the month, rain was observed for nearly half of the days on the month.
Rainfall
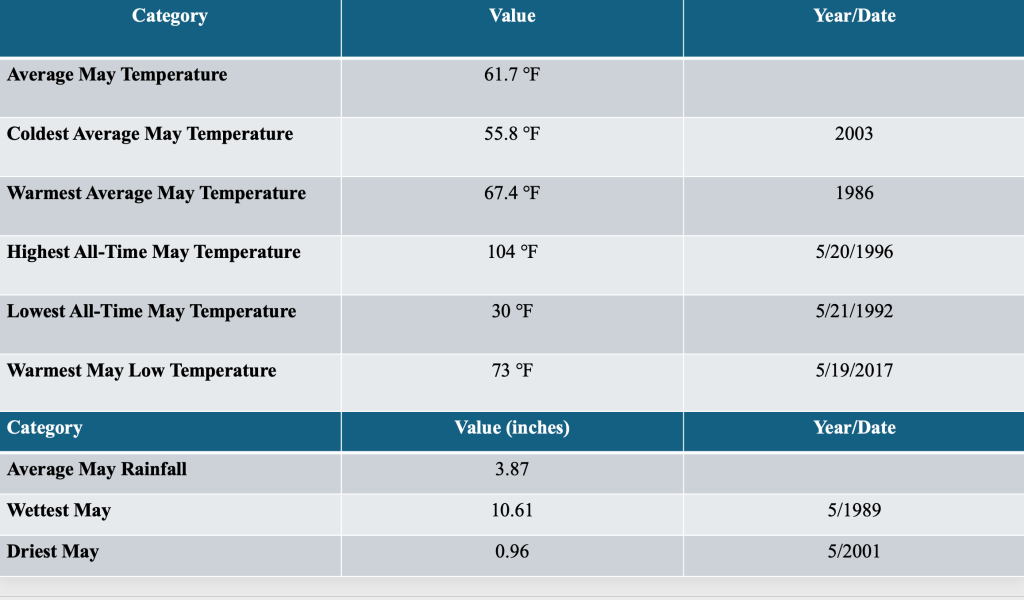
Unlike most months since late last fall, rainfall in the Bellcrest section of Toms River was much below normal. May 2024 was the first month since February 2024 not to have any daily rainfall records, and the highest rainfall for any calendar day during the month was about one-half inch (on the 23rd). While the average monthly rainfall for May is about three and three-quarters of an inch (3.87 inches), about one-third of the Mays in our database had monthly rainfall amounts much less than this.
May often differentiates the last of winter rainfall along the Jersey Shore and the beginning of the thunderstorm regime, when rainfall here is derived almost exclusively from storms. During the first half of the month, rain was recorded at the station seven times, which is more often than usual. However, rainfall amounts during these rainfall amounts were all below one-half inch, which is also unusual for May. It was as the rainfall was based more on the winter like rainfall than the beginning of the thunderstorm season.
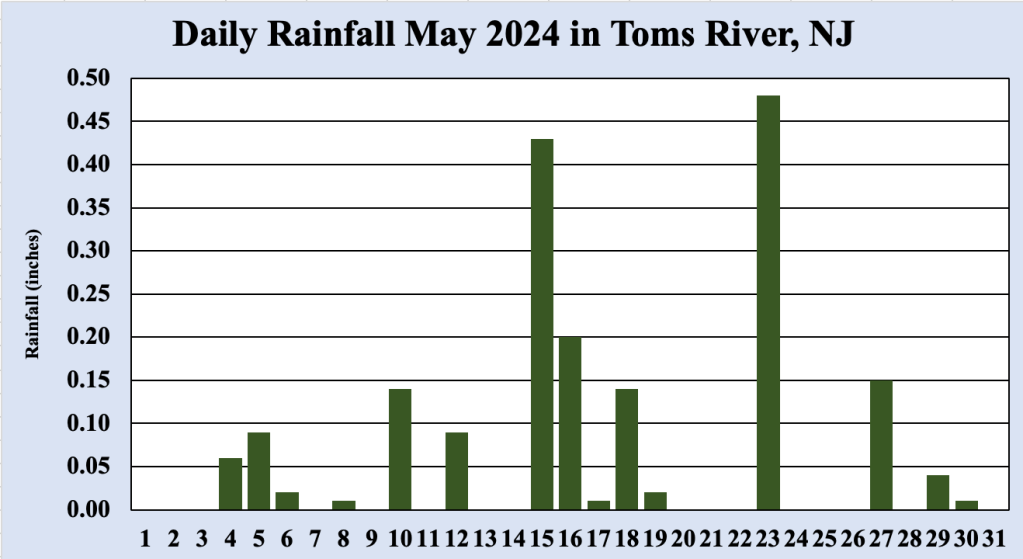
Thunderstorms did produce some rainfall along the Jersey Shore toward the end of the month, but not enough to put a dent in the sizable rainfall deficit for the month.
Temperature
May 2024 continued the trend of slightly warmer than normal temperatures started in April 2024. Though the final average temperature was above normal, there were streaks of above normal and below normal temperatures during the month, something that long time Jersey Shore residents have come to expect during the month. During the first half of May 2024, there were two peaks of above normal temperatures. as well as dips of below normal temperatures. During the above normal temperature periods, south to southwest low level winds brought warmer temperatures from the Mid Atlantic states, and a daily record high temperature was established on May 8th, when the mercury touched 89 degrees.
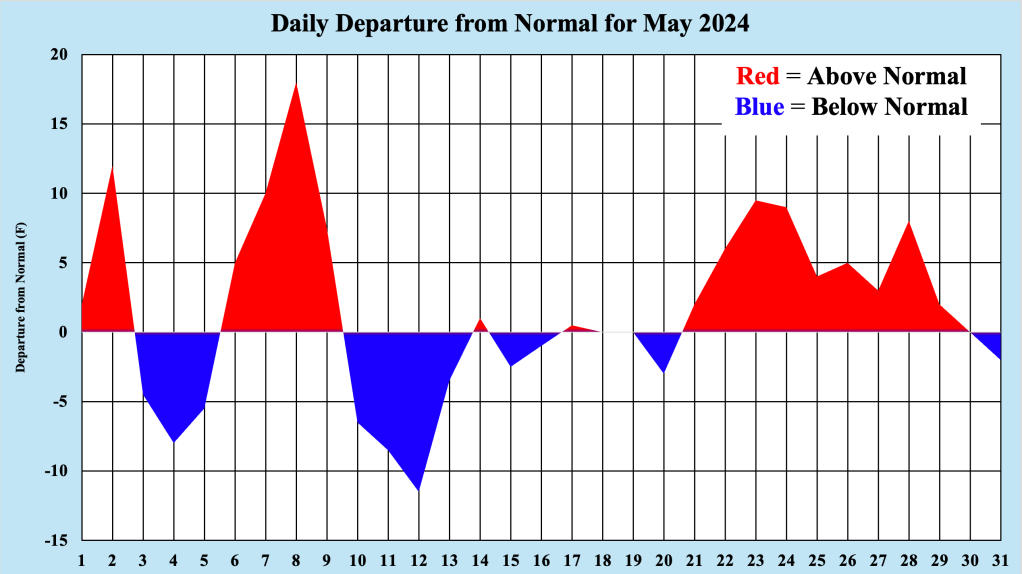
During the below normal periods of May 2024, the winds came from the northeast or southeast, ushering in still cool temperatures residing over the ocean. Though May often contains the first 90 degree reading of the year (as it did during 2024), it is also not unusual to experience days during mid and even late May that feature high temperatures closer to 60 degrees. However, as it often the case, the last 10 days of the month were more consistent with higher than normal temperatures, tipping the monthly temperature above normal for the month.
Thunderstorms
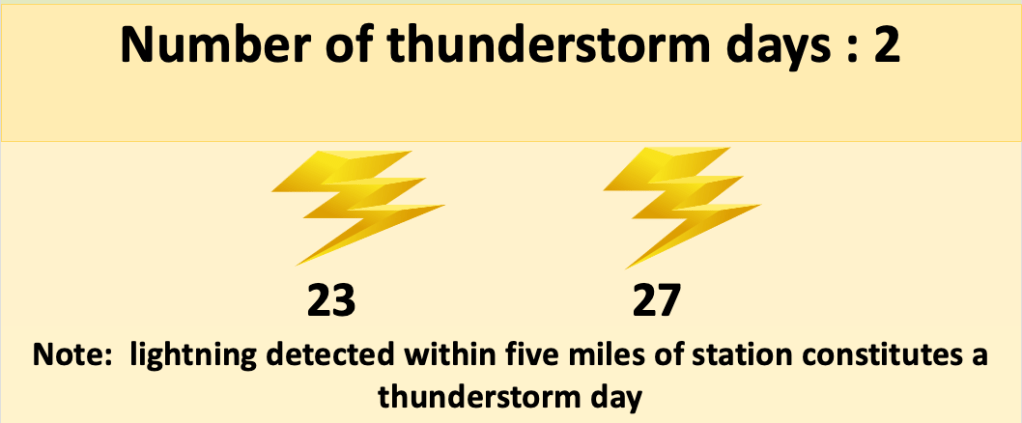
As we made the transition from the last of the winterlike rainfall early in May 2024 to the more recognizable thunderstorm pattern by the end of the month, two thunderstorm days were logged. This is one short of the number of thunderstorm days logged in May 2023, and unfortunately we do not have access to a reliable thunderstorm climatology that instructs us on the “normal” number of thunderstorm days for the month.
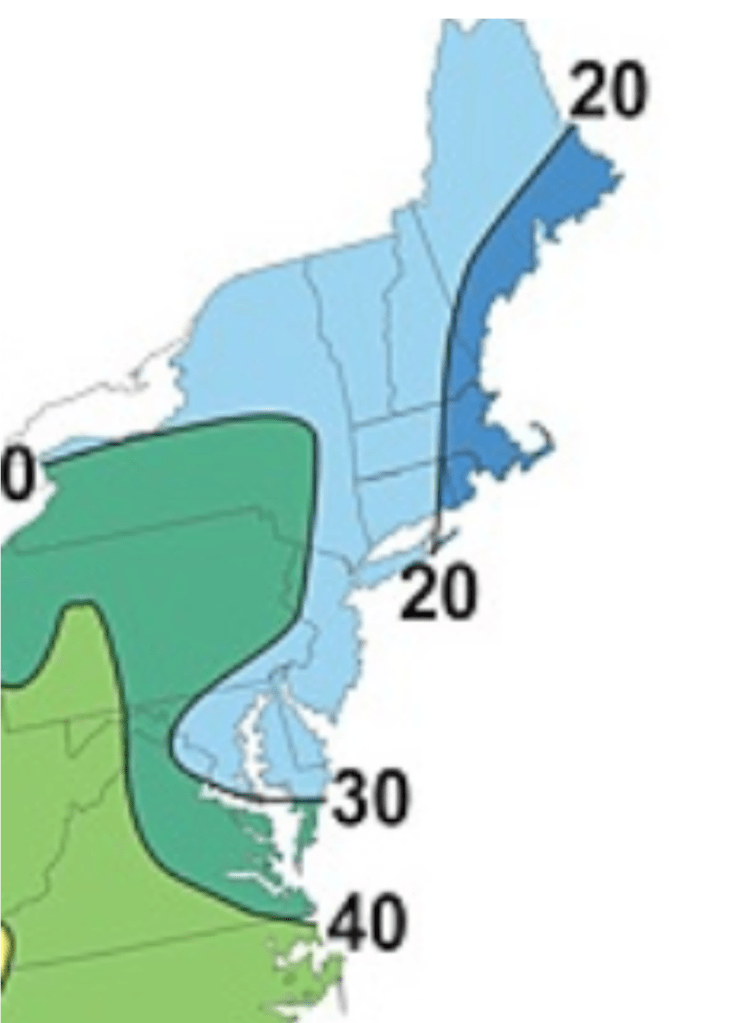
However, the number of thunderstorm days (days during with our Tempest Weather station logged lightning strikes with five miles) increased markedly during June and July 2023, when eight thunderstorms were noted for each month. Rutgers University recently published a map showing the average number of thunderstorm days per year for a large chuck of eastern PA and NJ, and the numbers we tallied from 2023 were close to these values.

Leave a comment