Overview
Rainfall has been measured at our weather station continuously since 1989, when we deployed our first 8 inch rain gauge. While an 8 inch rain gauge provides perhaps the most accurate method for measuring rainfall in a home weather station setting, it has three issues. First, someone needs to be present to empty the gauge of rainfall in order to keep records as precisely as possible. This level of dedication is admirable but not always possible, and could introduce error into the record keeping. The second issue involves accessibility. Back in 1989, 8 inch rain gauges could not be automated (at least not in a cost effective manner for us), so distribution of the rainfall information was limited, especially on a daily basis. Finally, frozen precipitation (in the form of snow and ice) needed to be melted before it could be measured, but during most events of this type we did our best to ensure someone could be available to melt the snow and ice.
Limited by time and expense, we used the 8 inch rain gauge as our primary rainfall collector from 1989 through mid 1997. Unfortunately, missing data was inevitable during manual weather data collection (as well as database issues that were separate from the data collection process), and some gaps in rainfall were noted, most notably during portions of 1994, 1996 and the first half of 1997. Even with the missing data, the rainfall database was robust, and we were meticulous when it came to making observations and recorded the results.
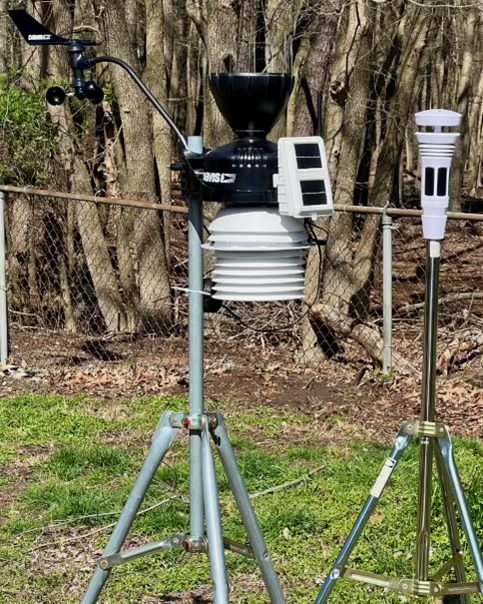
During 1997, we obtained our first Davis Weather Instruments weather station. Our primary rainfall collection platform shifted from the 8 inch rain gauge to a tipping bucket rain gauge. The weather station was automated, offering near real time access to the rainfall data, making it a much sought after method of collecting data. However, the tipping bucket rain gauge was not without its own issues. These type of rain gauges are notorious for underreporting rainfall rates, as well as actual rainfall amounts, during very heavy and extreme rainfall (like what might occur during summer thunderstorms). Rainfall amounts are generally not augmented in these situations, as reasonable alternatives are rarely available during thunderstorms.
Perhaps the biggest problem with the tipping bucket rain gauge (at least from our perspective) is accounting for frozen precipitation (snow). Precipitation events comprised mainly of snow (or a snow changing to rain events) will NOT be handled well by our tipping bucket rain gauge. In the past, we had a method for melting the snow as it fell into the rain gauge, but siting of our weather station no longer makes that a feasible solution. Instead, we edit the rainfall after the fact, making use of nearby observations to estimate the liquid equivalent of the frozen precipitation captured by the rain gauge.
Why Study Rainfall?
Removing missing weather data from our rain database, we have 32 years worth of rainfall data. This much data can tell us much about the weather to be expected in the vicinity of our weather station, but can allow us to learn about longer term trends and how they compare to changes in nearby weather stations. Using this dataset to determine means (averages) and extremes puts what is happening in near real time into perspective, aiding to understand the magnitude of events as they occur. The following treatise is not meant to be a compendium based on completely on statistics. Instead, statistics will be used to support some of the conclusions reached by working with the data, in real time and in the archive, for more than three decades.
Rainfall Analysis
Yearly rainfall
Of course, any discrete weather phenomenon (such as rainfall) can be measured on different time scales, depending on the needs of the user. For this analysis, we have chosen to begin with yearly rainfall, even though most people are more concerned with monthly data, as that is typically how rainfall is presented most often. We will follow up by looking at rainfall in the Bellcrest section of Toms River, NJ on the monthly time scale, and finish with rainfall on a seasonal scale, which might ultimately be the best way to review rainfall as a function of process (general rainfall versus rainfall with thunderstorms).
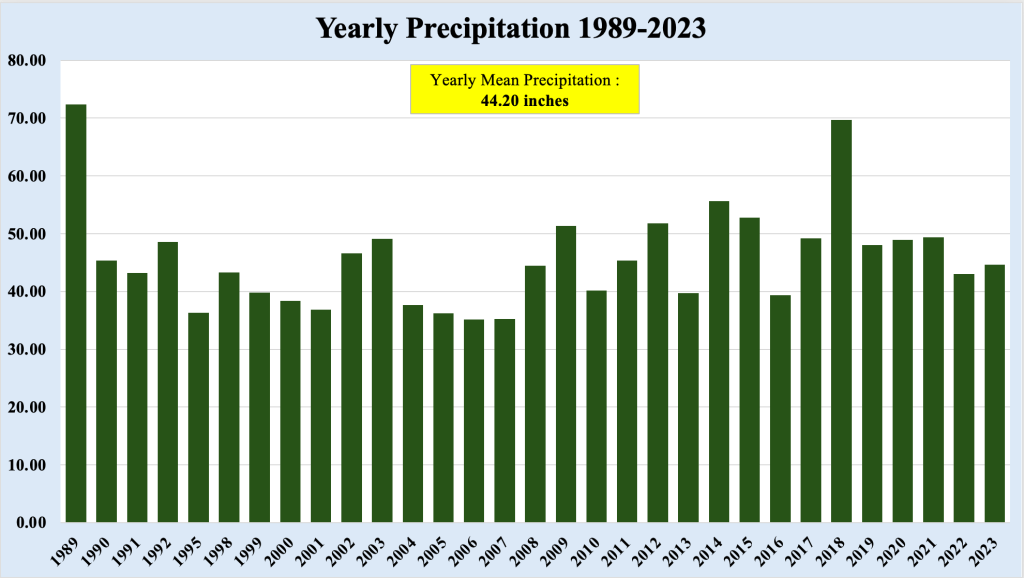
Figure 1 shows a plot of yearly rainfall for the Bellcrest section of Toms River, NJ for the period 1989-2023. Due to missing data in portions of 1993, 1996 and 1997, these years were dropped from the analysis, as the available data would have produced erroneous values of yearly rainfall. Perhaps the most interesting information from this plot is that the yearly rainfall averages 44.20 inches. For the most part, rainfall is distributed fairly evenly, with higher amounts in the warmer months and lesser amounts in the cooler months. However, because rainfall is a discrete value (rainfall can vary greatly over short periods of distance and time), rainfall is not always as evenly distributed as it may seem.
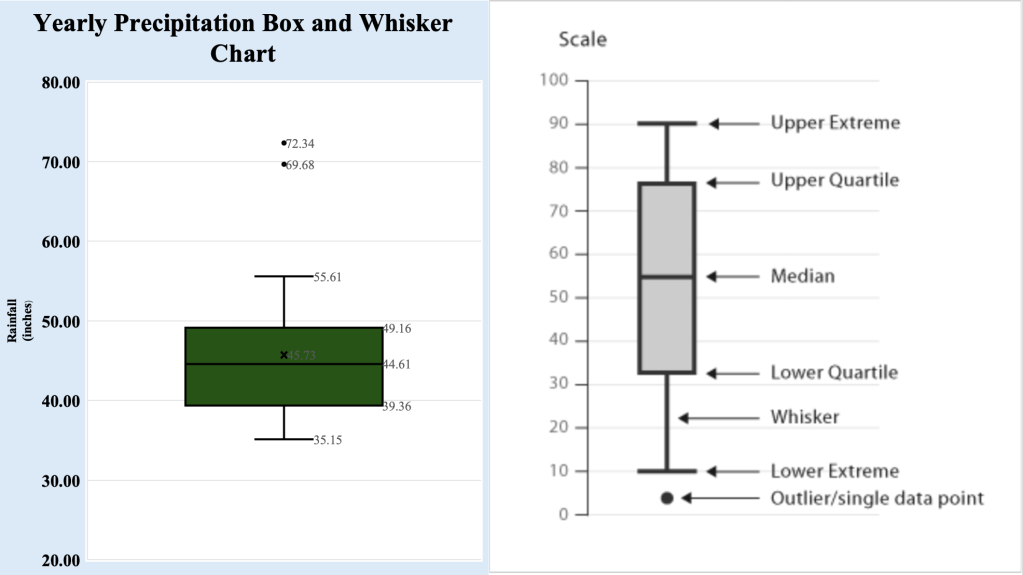
Climatologists and meteorologists, when attempting to describe differences from what is expected often employ a tool know as a box and whisker chart. This chart depicts some of the more often used statistical information used to describe numbers and displays them on a chart. Figure 3 shows a box and whisker chart comprised of the yearly rainfall data from Toms River, NJ. The green box (the box part of the box and whisker chart) in the middle of the chart shows the median value of yearly rainfall (which is like the average rainfall), as well as the higher and lower amounts normally expected. These values are close to what would normally be expected from yearly rainfall here.
The parallel bars above and below the box are the whiskers, the extreme values that should be expected for this location. These values roughly correspond to the highest and lowest yearly rainfalls between 1989 and 2023. So far, the rainfall does seem fairly well distributed throughout these years, and the box and whisker chart shows these values rather well. However, note the two dots at the very top of the chart. These values are the two highest yearly rainfall amounts in the database. These values are outliers, meaning they cannot be explained by the dataset itself, and are much higher than could be expected. So, while much of the data is distributed as expected, the presence of the outliers indicates that the distribution of rainfall may not truly be even.
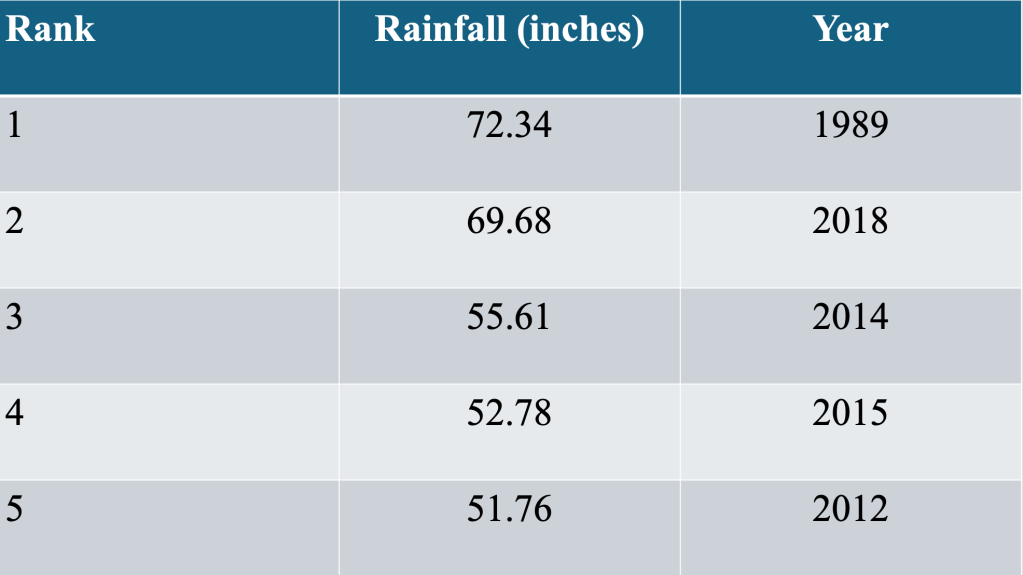
Looking more closely at the yearly rainfall information, we see that four of the five wettest years have occurred within the last 12 years. Overall, the pattern has been for more storms to affect the Jersey Shore during this time. In addition, more thunderstorms have impacted Toms River, NJ during the past decade, resulting in higher yearly rainfall amounts. This will be covered more in depth in the monthly rainfall section.

Figure 1 also shows a number of years during the 2000s when yearly rainfall was much lower than normal. In fact, four of the five driest years on record in Toms River occurred between 2001 and 2007. The overall weather pattern across the Northeast United States favored drier and cooler conditions (which was evident in the temperature data for Toms River, which can be seen here). Many places across the Eastern US had drought conditions during this time, and explains much of the lower than normal rainfall years in the 2000s.
In review, looking at yearly rainfall allows up to identify year to year changes, as well as longer term trends (such as the drier than normal period in the 2000s), but does not allow us to view more nuanced change, because of the amount of data included in the analysis.
Monthly Rainfall
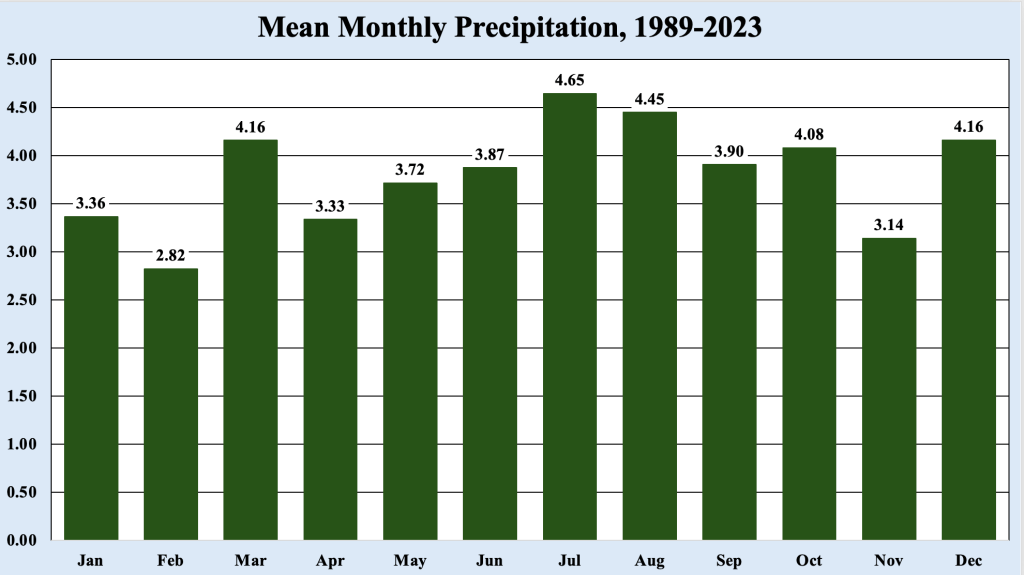
Figure 4 shows the mean (in this context, average and mean are synonymous) monthly precipitation for the length of the rainfall dataset. This method of examining rainfall is much more familiar to those who study weather data, and is presented for many locations across the country by the National Weather Service. As might be expected, the winter months receive less precipitation than the summer months, but overall the rainfall seems to be evenly distributed.
Differences in monthly rainfall amounts are much easier to describe than differences between yearly amounts, as the weather processes that produce variations from month to month are better understood. For example, the driest month of the year tends to February, and this is true for two main reasons. First, the airmass tends to be driest in February (though January is close), so precipitation production would be more difficult when the airmass is drier overall. Second, February is the shortest month of the year, and the differences of two or three days is enough to skew the monthly mean rainfall lower.
Contrast February with July and August, which have the highest mean rainfall and second highest mean rainfall during the year, respectively. The airmass during these months contains much more moisture than it does in February, and thunderstorms tap into this moisture to produce much higher rainfall amounts than cooler months.
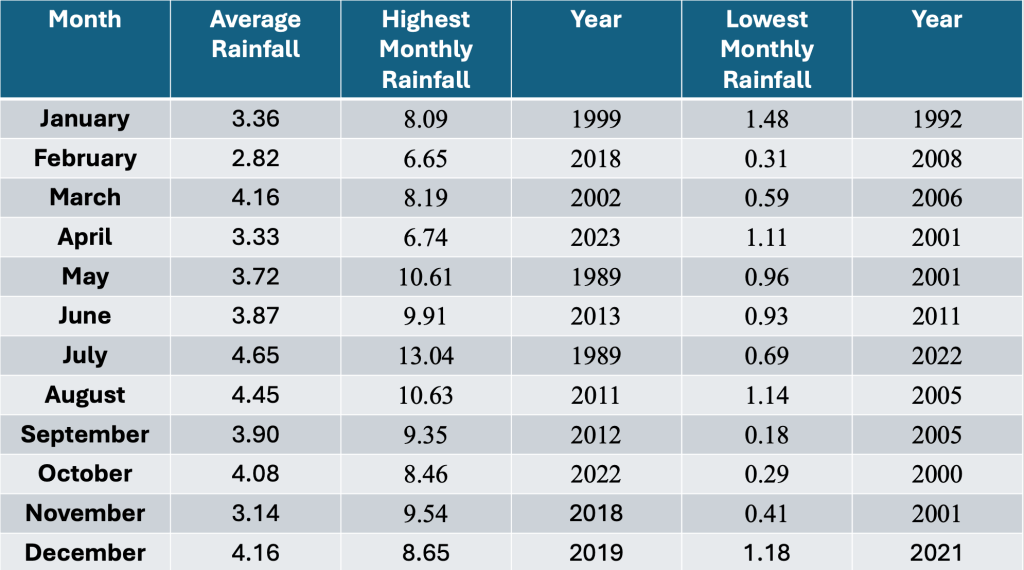
Even with monthly rainfall data, there is a fair amount of variability when it comes to rainfall amounts, regardless of the time of year. For example, while the average rainfall for July is 4.65 inches, the difference between the highest rainfall and lowest rainfall in July is more than a foot! Though not as impressive, May through September have similar differences between the wettest and driest of each month, when compared to the cooler months (generally November through April).
Of course, the larger differences during the warmer months is mainly tied to thunderstorm activity. Warmer months have higher moisture values, which leads to higher rainfall amounts during thunderstorms. During the summer along the Jersey Shore, almost all of the rainfall is due to thunderstorm activity, so a month with lower thunderstorm activity will have much lower rainfall amounts (as seen in Table 3).
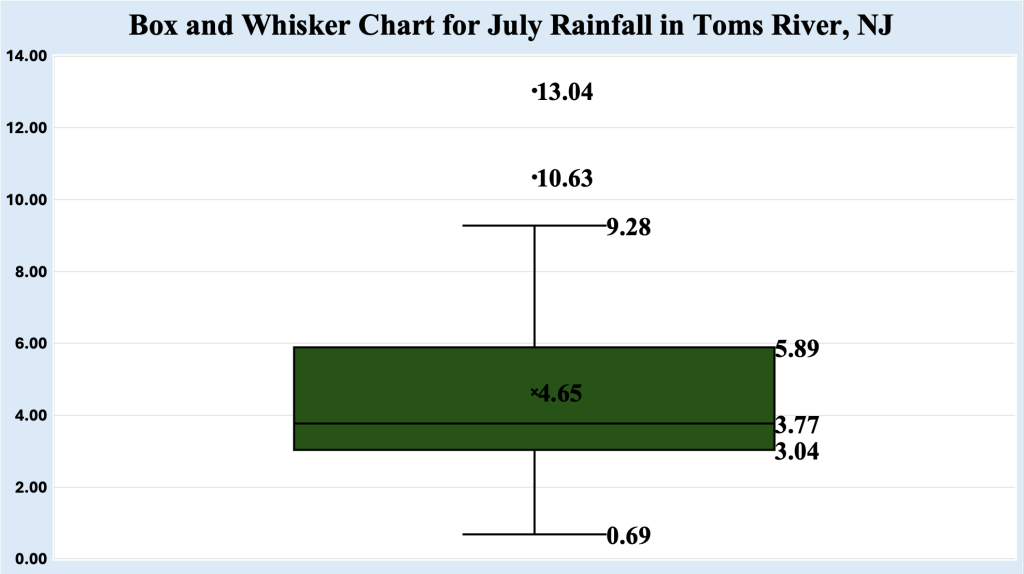
Figure 5 shows another box and whisker chart, this time for July rainfall in the Bellcrest section of Toms River, NJ. Note the 4.65 inch value next to the x inside the box, indicating the mean value of rainfall for July. The values of 5.89 inches and 3.04 inches are the values that can be expected from the 32 years of rainfall data, meaning that at least two of three July will have rainfall amounts between these two values.
The lower whisker shows the lowest rainfall amount recorded in July (which matches the value in Table 3), but the upper whisker shows 9.28 inches, which is the value expected for this whisker based on what has occurred during July in the past. There are two values well above the upper whisker, known as outliers, that are well above what might be expected for this location in July. Presence of these outliers indicates that rainfall in July is not evenly distributed, and that the high moisture content of the air during that time can produce extreme rainfall amounts.
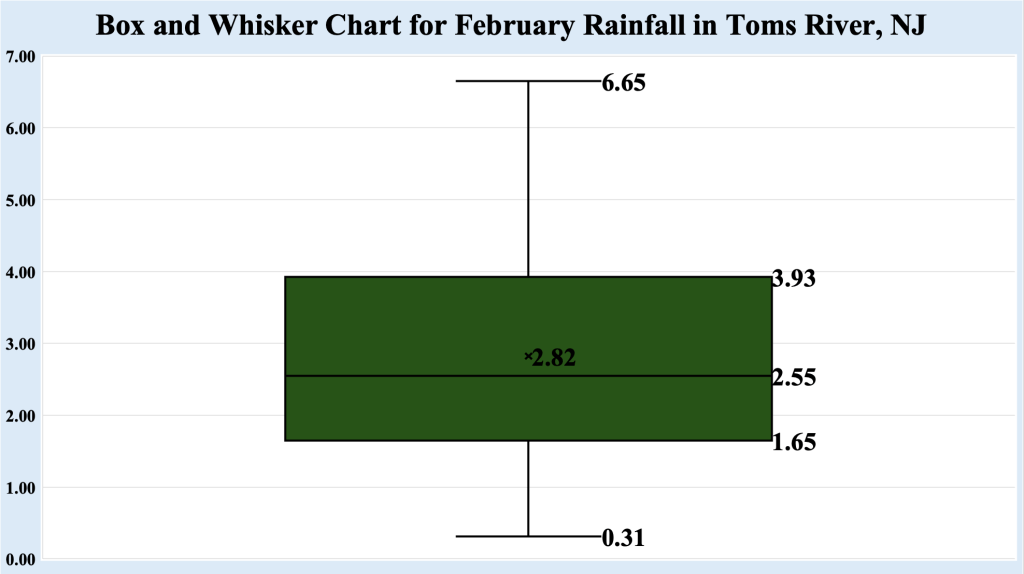
Figure 6 shows another box and whisker chart, this time for February rainfall in the Bellcrest section of Toms River, NJ. Again note the 2.82 inch value next to the x inside the box, indicating the mean value of rainfall for February. The values of 3.93 inches and 1.65 inches are the values that can be expected from the 32 years of rainfall data, meaning that at least two of three Februarys will have rainfall amounts between these two values.
Unlike the July box and whisker chart, the February chart has lower and upper whisker values that match the driest and wettest February months from Table 3. This mean February rainfall follows a much more predictable pattern than July, due primarily to the fact that there is almost no thunderstorm activity in February, which would result in rainfall being more evenly distributed.
To review, viewing monthly rainfall totals is more familiar for most weather users, as it is the default look for most media outlets. Viewing monthly rainfall amounts allows us to identify more nuanced differences from month to month, something not easily discernible with yearly rainfall data. Even monthly data does not fully describe the variability at this level, as some of the box and whisker charters demonstrate. However, it does allow us a better look at how common weather patterns affect monthly rainfall.
Seasonal rainfall
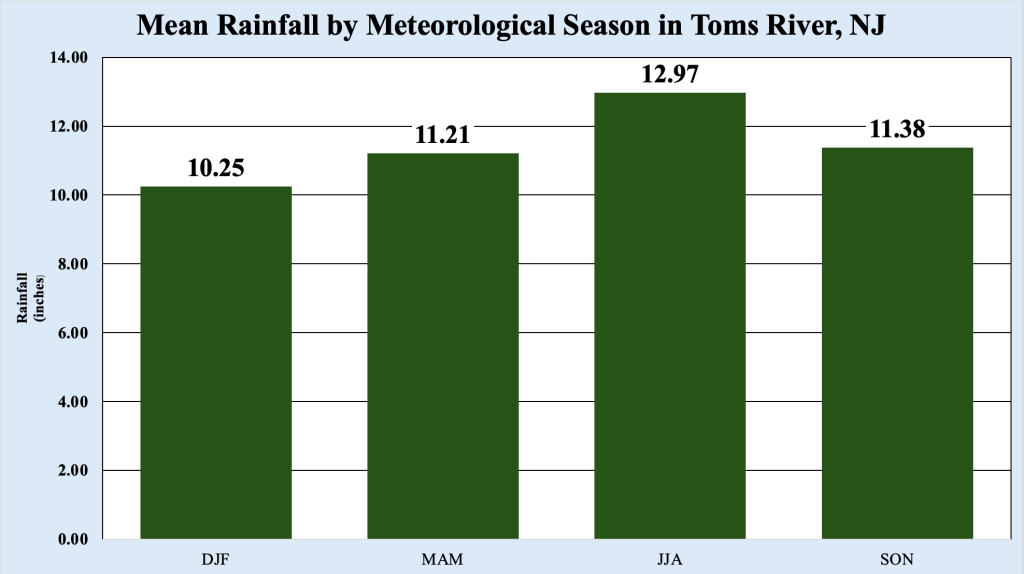
From a meteorological standpoint, it might make the most sense to study rainfall by season, rather than yearly or monthly. Looking at seasonal rainfall allows us to better identify patterns that result in rainfall amounts, instead of attempting to frame them by temporal definitions that are not as conducive to identifying these patterns. In order to make the math easier, the four meteorological seasons are assigned as follows:
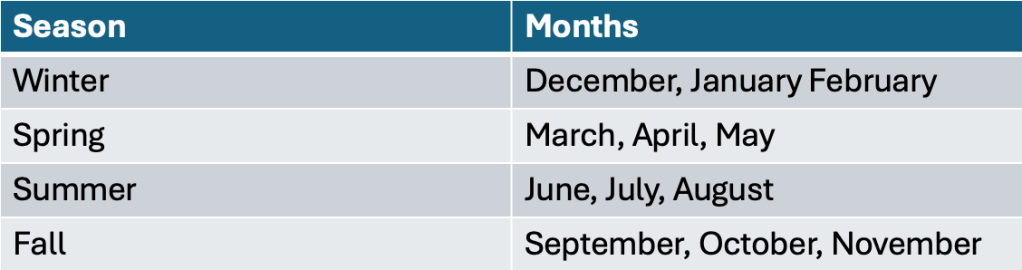
Figure 7 shows the mean values of rainfall for each of the four meteorological months in Toms River, NJ. Note that the season with the lowest mean rainfall is winter, and this is not unexpected, as these months generally have the lowest moisture content in the atmosphere. Rainfall is driven almost exclusively by winter like storms, and thunderstorms are rare during this time. Though rainfall is generally well distributed during winter, amounts can be dependent on the overall winter pattern. This was the case during the winter of 2024, when 15.66 inches of rainfall was recorded in a very wet patten, which was 33 percent higher than average.
Spring averages about an inch higher than winter with respect to rainfall amounts. March along the the Jersey Shore generally starts in a winter pattern, and most of the rainfall can be attributed winter storms, which become less common later in the month. April starts the transition from winter type precipitation to rainfall being dominated by thunderstorms. However, if thunderstorms are scarce during April, rainfall can average well below normal during this transition season. By mid May, winter like storms have ended across NJ, and rainfall becomes much more driven by thunderstorms. Like April, if the pattern does not allow thunderstorms to affect the Jersey Shore, rainfall amounts can average well below normal.
Rainfall during the summer is almost exclusively driven by thunderstorms (though a couple of tropical systems have contributed to rainfall totals in the database). Thunderstorms are common events across eastern PA and western NJ, but become less common as storms approach the Jersey Shore. The sea breeze often brings cooler air across the shore, cutting off the fuel from storms, and as a result, they weaken as they approach the ocean. When in weather patterns that favor storms reaching the coast (i.e., days with no sea breeze), rainfall amounts can be prodigious, which explains the widely varying values from Figure 5.
Finally, the transition from thunderstorm based rainfall to more winter like storms occurs during fall. During September and October, decaying tropical systems (or their remains) interact with fronts, which can result in very heavy rainfall during these months. However, the reverse can be true, and since these months do not yet receive much rainfall from winter like storms, no tropical interactions can mean these months may be very dry. November rainfall tends to be less than September and October as thunderstorms are rare, and winter storm rainfall is low to ramp up.
Viewing rainfall from a seasonal perspective allows us to better identify weather patterns over a longer period of time than monthly rainfall analysis. Analysis shows that the differences in rainfall can better be explained on the seasonal level, as winter storms, thunderstorms and possible tropical systems follow familiar patterns, and provide more reliable data with respect to the distribution of rainfall in the Bellcrest section of Toms River, NJ.

Leave a comment