Introduction
Our weather station in the Bellcrest section of Toms River was born of humble beginnings, getting its start using various store-bought thermometers to record high and low temperatures, starting in March of 1978. Temperature records this early were quite sporadic, as we were still in school and did not get to record temperatures every day. However, starting in 1980, we were careful to ensure temperatures were logged each day during the winter months.
This approach continued until 1986, when the combination of college and work reduced our ability to reliably record temperatures. Acquiring a CompuTemp (which semi-automated the temperature recording process) in late 1989 led to a much more complete dataset. Adding a plastic 8-inch rain gauge in 1990 (which required someone to measure the rain and empty the gauge), we included added precipitation to our database. However, we did not measure snow, as we were not always present during snowstorms. Moving robbed us some data (which was apparently lost in the shuffle) in the mid 90s, but our database became automated in 1997 with the acquisition of our first Davis Instruments weather station. With the advent of the Davis Instruments station, our database has been virtually complete (except for a 10 day period around the time of SuperStorm Sandy in late October and early November 2012).
We still use Davis Instruments equipment to this day for our official database, but this past winter we added a Tempest weather station. It has a lightning sensor, and we are excited to add that element to our database. What see you in this project is the passion for weather, which remains almost unabated more than 40 years. This treasure trove of information allows us to analyze temperature for trends over decades, allowing us to identify patterns common to hot and cold periods at the Jersey Shore.
Fire: Hot Temperatures in Toms River, NJ
While there is no objective definition of “hot temperatures”, for simplicity’s sake, a hot day at the Jersey Shore is defined as a day where the high temperature reaches or exceeds 90 degrees. When the National Weather Service (NWS) defines a heat wave, they state that it comprises three consecutive days of temperatures of 90 degrees or above, so that is the standard we will use here.
Of course, hot temperatures can be a matter of opinion. When the humidity is high, it can feel hot even when temperatures top out in the 80s. However, including humidity in the definition of hot weather can complicate the matter, so including only the air temperature ensures that we are comparing “apples to apples” when talking about hot weather in Toms River, NJ.
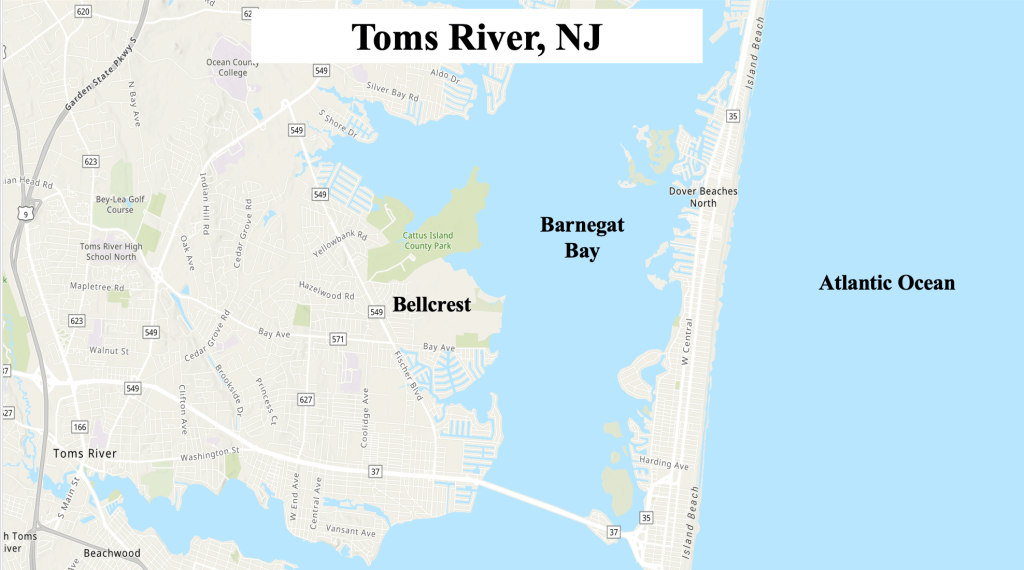
The Bellcrest section of Toms River, NJ is located along the coast of central NJ, just west of the Barnegat Bay. Our weather station is about three and one-half miles from the Atlantic Ocean, which has a profound effect on weather conditions year round. During the warmer months (generally April through October), the ocean can have a cooling effect in Toms River, as the denser, cooler air from the water the ocean makes it way inland. Known as the sea breeze, this onshore flow develops when the offshore flow is relatively weak (generally less than 10 mph), and the difference in the temperature between the cooler ocean and warmer land creates an onshore wind.
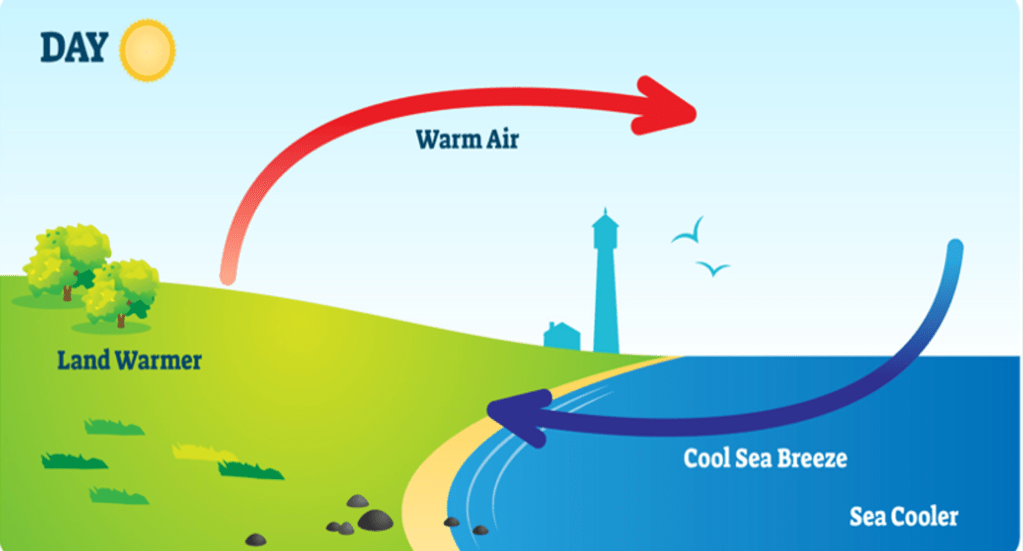
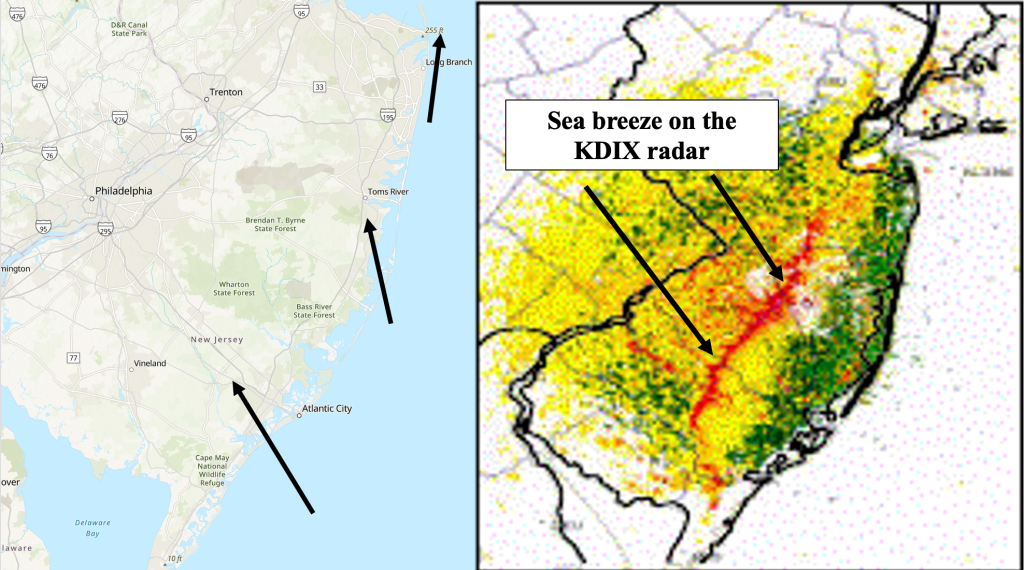
During the summer months, the sea breeze forms often, keeping the immediate shore cooler than points further inland. This is often reflected by a change in wind direction and a cooling of temperatures in the early afternoon, when temperatures are still rising further inland. The circulation, as depicted in Figure 3, can become quite strong, occasionally traveling west toward the Delaware River (and can be tracked on NWS Doppler Radar). However, the sea breeze affects the coastal sections first, resulting in fewer 90 degree days than points just to the west.
On average, the Bellcrest section of Toms River, NJ experiences 21 days with high temperatures of 90 degrees or higher. However, this number does not fully encompass how frequently the Jersey Shore reaches that particular temperature. Often the number of 90 degrees days is dictated by the number of days when the sea breeze is active. In general, more sea breeze days means less 90 degree days, because the cooling effect of the ocean does not allow temperatures to rise that high.
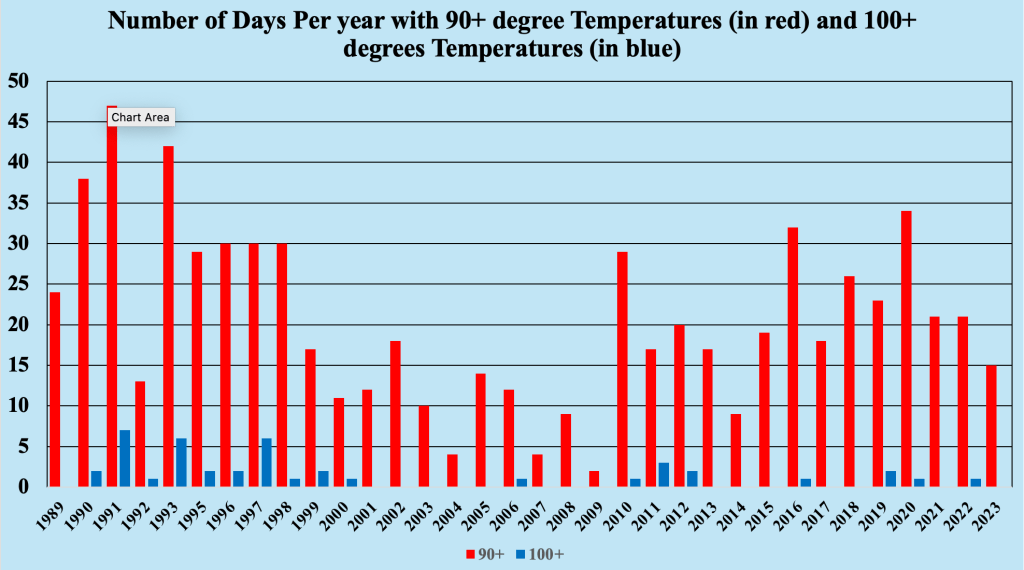
Figure 5 shows a plot of 90 degree (and 100 degree) days from 1989-2023. Note the higher number of 90 degree days in the early 1990s, contrasted against the paucity of such days in the mid 2000s. These differences cannot be explained sufficiently by attributing them as simply flow regimes that encourage or discourage the development of a sea breeze. The sizable difference is more likely tied to changes in the large scale flow (which is beyond the scope of this blog entry). The number of 90 degree days made a comeback in the 2010s and 2020s, again likely tied to another change in the large scale flow.
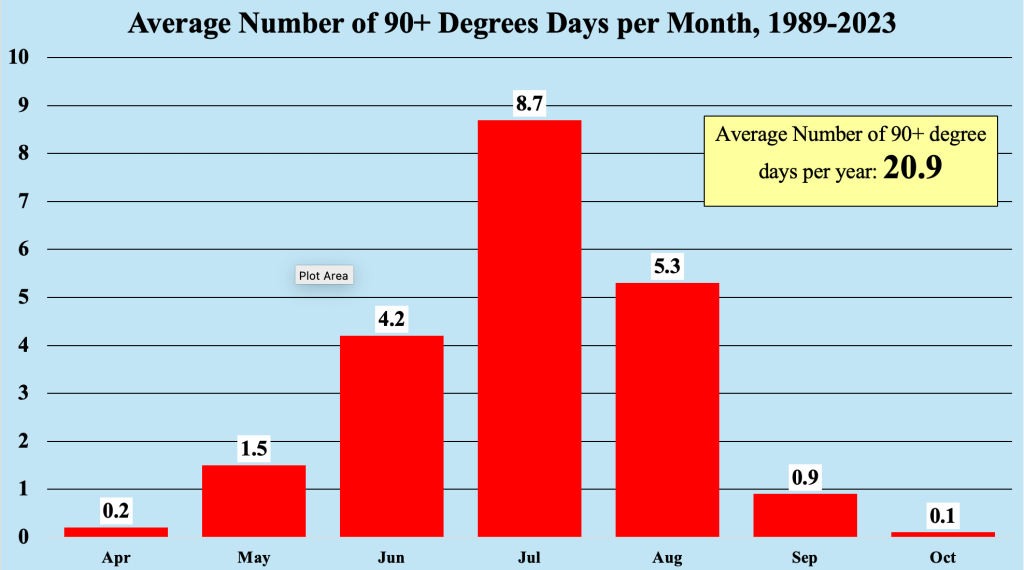
As might be expected, the month with the highest number of 90 degree days is July, with nearly nine expected each year. While having the most 90 degree days during the hottest month of the season makes sense, there is another reason for the highest number of 90 degrees during July. Ocean water temperatures warm slowly, and by July, they warm enough so that the development of the sea breeze is delayed, allowing temperatures to get warmer than they would in May or June.
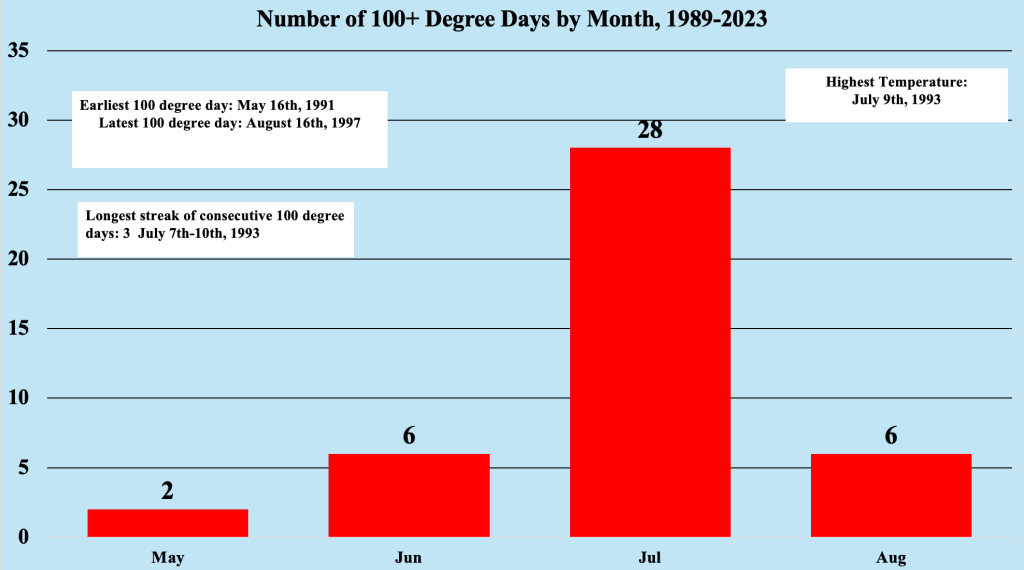
In comparison to the number of 90 degree days per year (which are relatively common), the number of days where high temperatures reach or exceed 100 degree is much smaller. The reason for this is rather simple, but does require some explanation. During the summer months, when the relative humidity is generally higher, the moisture in the air needs to be warmed, along with the air itself. Typically, higher amounts of moisture in the air make it more difficult for the air to attain very high temperatures. For the most part, especially later in the summer when the sea breeze is not as effective in cooling the coast, 90 degree temperatures happen more often, despite the amount of moisture in the air.
To reach 100 degrees, the air must be drier than normal, so that all of the warming increases the temperature, and not warming the moisture in the air. Consequently, the number of 100 degrees days is necessarily lower. Between 1989 and 2023, there were only 42 days with high temperatures of 100 degrees or higher. On average, there is one 100 degree day per year between 1989 and 2023, but that number is misleading. Since the conditions that support 100 degree days do not occur often, the days with high temperatures of 100 degrees or higher tend to occur in streaks of two or three. In fact, only 16 of the 34 years between 1989 and 2023 had high temperatures of 100 degrees or higher, which is just short of 50 percent.
To recap, hot days (days where the high temperature reaches of exceeds 90 degrees) occur, on average, 21 times per year in the Bellcrest section of Toms River, which is about three and one-half miles from the Atlantic Ocean. The sea breeze generally keeps the number of hot days along the Jersey Shore to a minimum, when compared to locations further away from the coast. Factors influencing the number of 90 degree days are determined by local effects (such as the sea breeze), as well as changes in large scale flow, so the number of such days can vary greatly from year to year.
Ice: Cold Temperatures along the Jersey Shore
Just as there are subjective descriptions of what constitutes a “hot” day in Toms River, NJ, there are varying opinions on what makes a “cold” day in the same location. Proximity to the ocean results in fewer cold days near the shore (when compared to locations just inland), as the ocean cools slowly through the fall into early winter, and does not typically reach its coldest temperatures until February. To keep it simple, we will define a “cold” day during which the low temperature drops below 32 degrees. Admittedly, this might be an oversimplification of what makes a day cold, but using this value allows for easier comparison of cold from year to year.
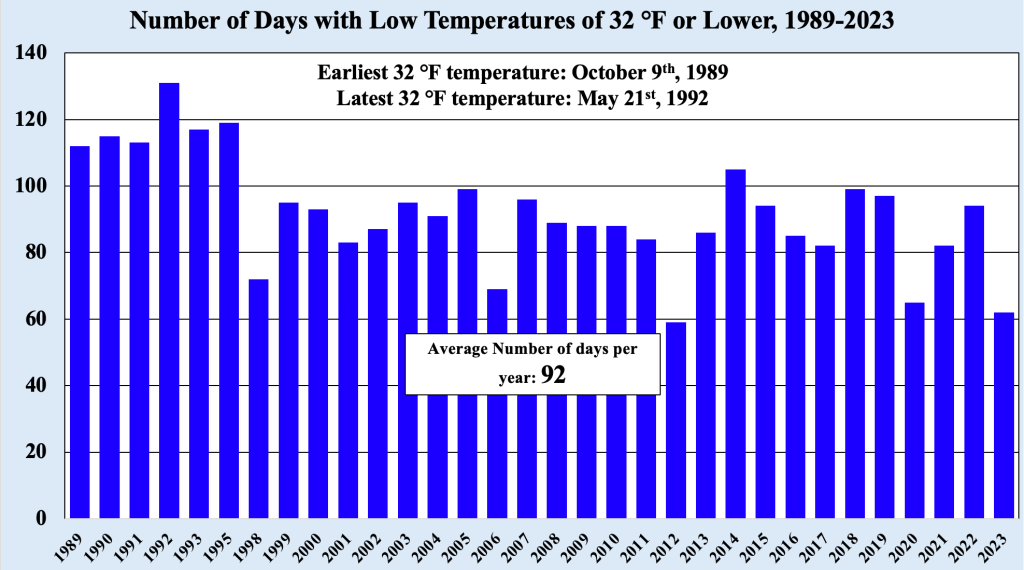
On average, 92 days per year had low temperatures of 32 degrees or lower during the period 1989-2023. However, like many weather elements expressed as averages, this number can be misleading. Based on the chart in Figure 8, the highest number of days with cold temperatures occurred in the early to mid 1990s, when the number of cold days always exceeded the average. This difference can be attributed to the large scale flow over NJ, which favored colder winters during this time.
After that time, taking into account the variability among years, the number of days with low temperatures of 32 degrees or lower has slowly decreased. As might be expected, there are years with a much higher number of “cold” days followed by years with much fewer days, but overall the trends has been for less “cold” days with time.
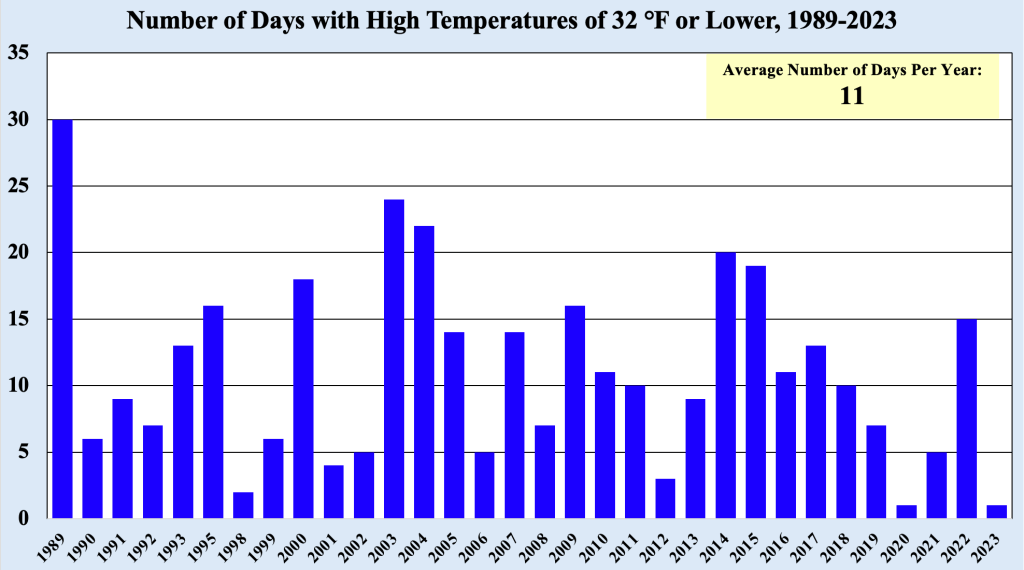
In my youth, I did not consider a day “cold” unless the high temperature failed to break the freezing mark. A snow fan, this temperature was the warmest tolerable to allow snow to fall on the Jersey Shore, which did not happen much when I was younger (though that changed in the late 1970s). Using this criterion as the definition of a cold day, the number of such days drops dramatically when compared to low temperatures of 32 degrees or lower.
Figure 9 shows that the average number of days with high temperatures of 32 degrees or lower, but as has been the case for much of the analysis, the average is a misleading figure. The high number of “cold” days in 1989 can be attributed to the coldest December on record that year. More than half of the cold days that year occurred during that cold month; otherwise, the year was close to normal. There are other years with higher number of “cold” days (such as 2003, 2004, 2015, 2015), but like the previous definition of “cold” days, the trend has been downward through the time frame. Both 2020 and 2023 had one day with high temperatures of 32 degree or lower, easily the lowest values in the data set.
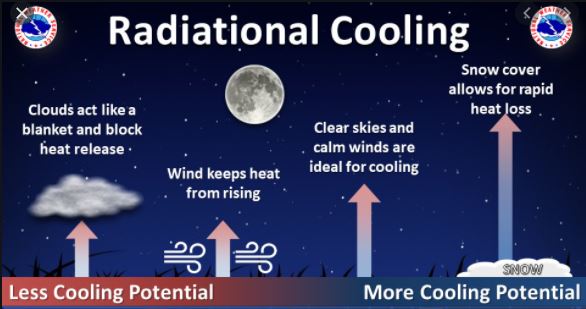
Perhaps the ultimate definition of a cold day is one with a low temperature (or high temperature, for that matter) of zero degrees or colder. Being close to the ocean, it modifies the airmass in Toms River so that these levels are rarely experienced. For the most part, snow cover needs to be be present for temperatures to drop below zero at this location, as radiational cooling allows temperatures to drop more rapidly when the ground is snow covered versus when it is bare.
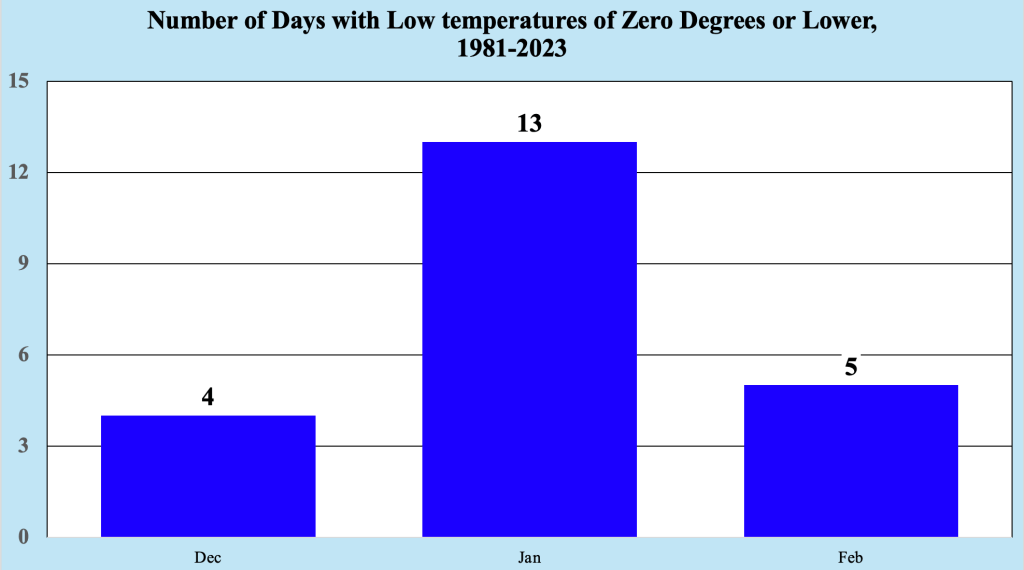
Snow cover along the Jersey Shore is generally fleeting during the winter, rarely lasting more than a few days. Hence, the above described conditions do not happen every year. Figure 10 shows the number of days with low temperatures of zero degrees or lower. For most of this blog entry, the time period of 1989-2023 was used to ensure a more complete dataset. In the case of low temperatures of zero degrees or lower, the data set was opened to include data back to 1981, as we kept more complete temperatures records during the winter months.
Low temperatures of zero degrees or lower average less than once a year, but in reality these low temperatures are much more rare than that. Much like high temperatures of 100 degrees or higher, conditions supporting lows of zero or below are in place for a few days, and subzero low temperatures tend to occur in streaks. For example, low temperatures of zero or below occurred during three consecutive days (or more) in January 1981, January 1982, January 1994 and February 1996. Removing these values means that low temperatures of zero degrees or low occur about every three or four years, and the last zero degree morning in the Bellcrest section of Toms River, NJ happened on January 7th, 2018.
To recap, cold days are more frequent than hot days along the Jersey Shore, but if we adopt a more strict definition of “cold” day (such as high temperatures of 32 degrees or lower), that is not the case. For the most part, “cold” days are become less frequent, regardless of the criteria used, and their numbers are highly variable, as might be expected. The total number of days with low temperatures of zero degrees or colder has dropped considerably since the 1980s, with the last occurrence happening more than six years ago.

Leave a comment