Overview

Meteorological winter consists of December/January/February, rather than the more typical definition of (approximately) December 21st to March 21st. Meteorologists use the first definition because it simplifies calculations, rather than attempt to account for the irregular number of days the second definition brings with it. For the sake of brevity, the term winter herein will refer to meteorological winter.
Weather records have been logged in the Bellcrest section of Toms River, NJ since 1978, though they are fragmented early due to inconsistent daily observations. Temperature recording became automated in late 1989, the same year rainfall records were initiated. With the acquisition of our first fully automated weather station in 1997, the weather database has been complete since that time, save for a 10 day period in late October and early November 2012, due to power outages associated with Superstorm Sandy.
In order to create a homogenous database for the analysis of meteorological winter, only winters with complete temperature records for consecutive Decembers, Januarys and Februarys were considered. Using this criterion, 35 winters were available in the weather database. Since the rainfall records started in 1989, rainfall analysis is only possible from that time. Finally, because there was not always someone to measure snowfall before automation, snowfall records were not available for this analysis.
Temperatures
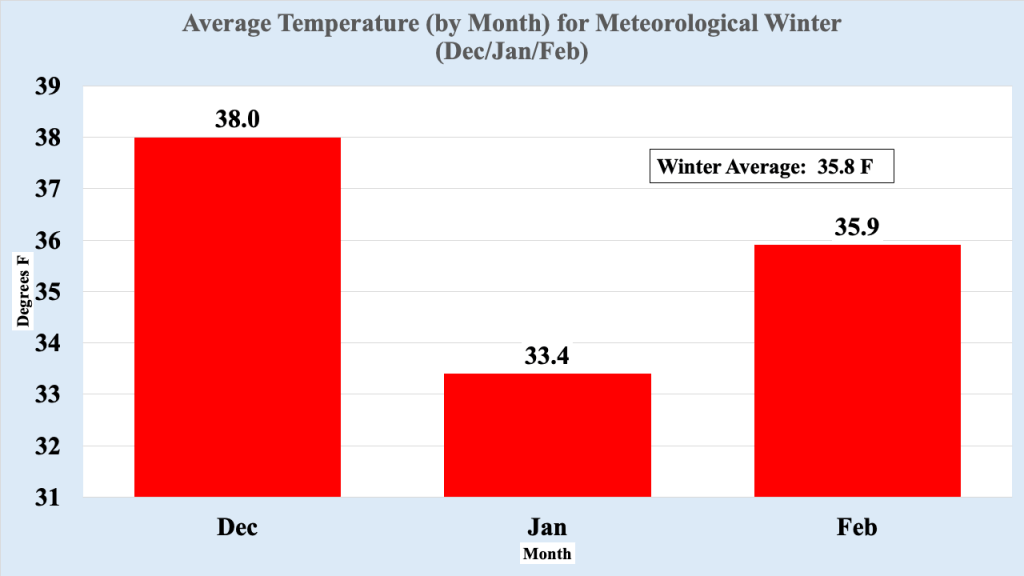
Typically, December is the warmest of the three month winter period, with January the coldest, followed by some rebound in February. However, in almost one-third of winters, February is colder than January. Many factors make this possible, such as the Arctic delivering cold air to NJ later than usual, but having snow on the ground in mid to late January allows colder air from the north to remain cold, rather than absorb heat from a snowless ground cover. Occasionally, December is the coldest month of the winter, but this occurs less than ten percent of the time, most notably in the winter of 1989/1990, when December was the coldest month ever recorded in the Bellcrest section of Toms River (where temperature records are available back through 1978).
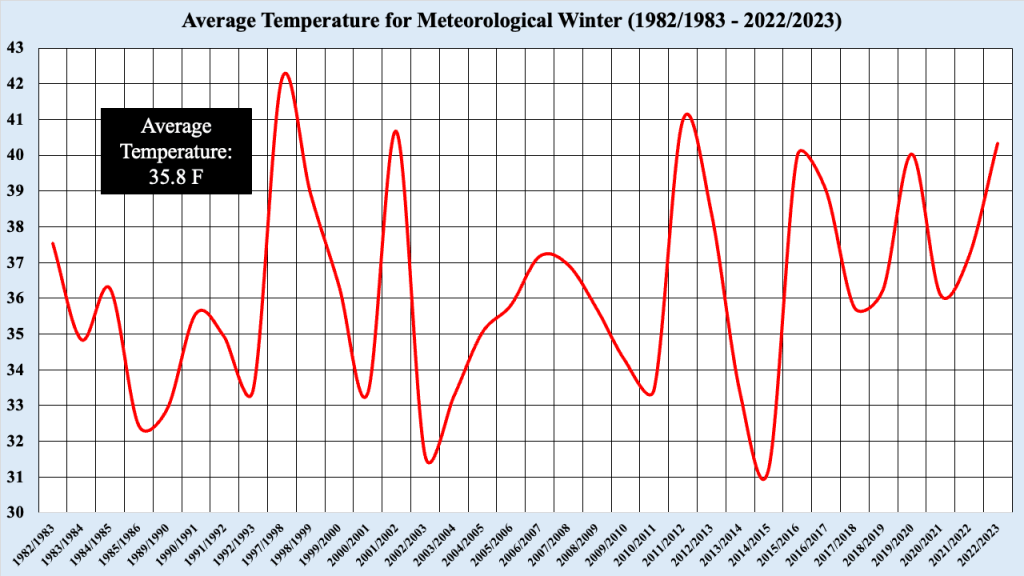
While the average temperature for the winter is 35.8 degrees F, this number can be misleading, since few winters actually experience “normal” average winter temperatures. Figure 3 shows a plot of the average winter temperatures for all 35 winters included in this analysis. There is a considerable amount of spread when it comes to average winter temperatures, indicating many possible explanations for the large swings in average temperatures, many of which are beyond the scope of this analysis. Due to the spread, the average has little meaning when it comes to describing a “typical” winter with respect to temperatures in Toms River.
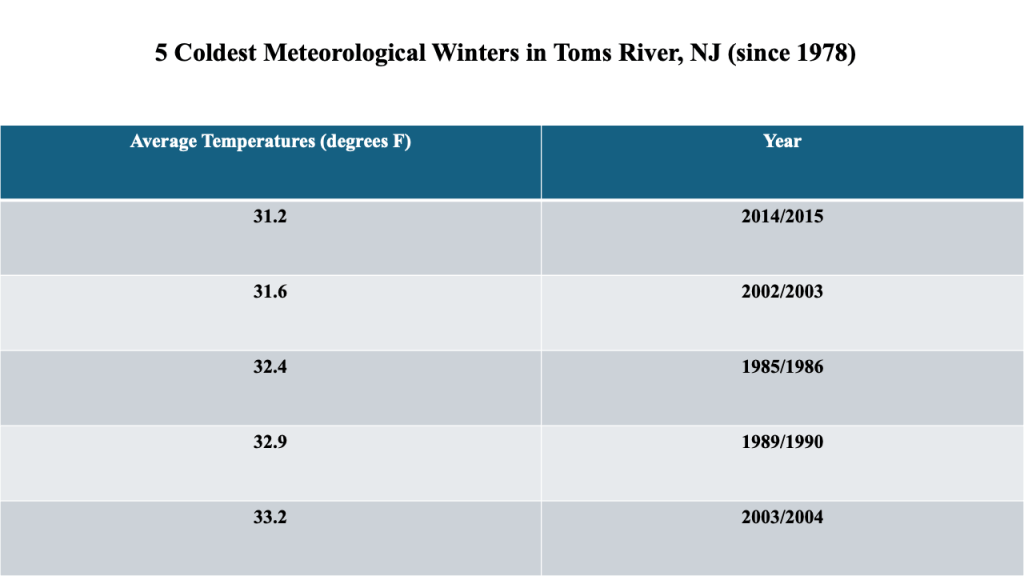
Not surprisingly, there was a large amount of spread between the five coldest winters and five warmest winters in this analysis. The coldest winter (2014/2015) was anchored by the coldest February on record for this location (with an average temperature of 23.9 degrees F, making it the second coldest month on record here). No records were set for the second coldest winter (2002/2003); instead, it was consistently cold from December 2002 through February 2003.
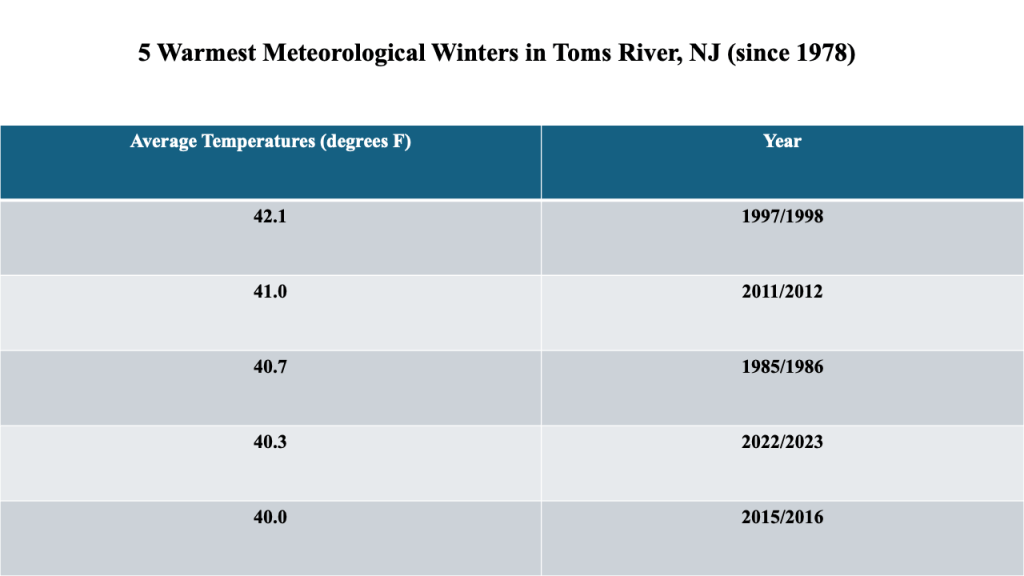
The warmest winter on record occurred in 1997/1998. This winter was consistently warm, augmented by a record warm January 1998 (47.1 degrees F, which is closer to the average temperature for March). All of the next four warmest winters occurred since the winter of 2001/2002, and while there is still spread between years, winters have been consistently warmer since 2015/2016.
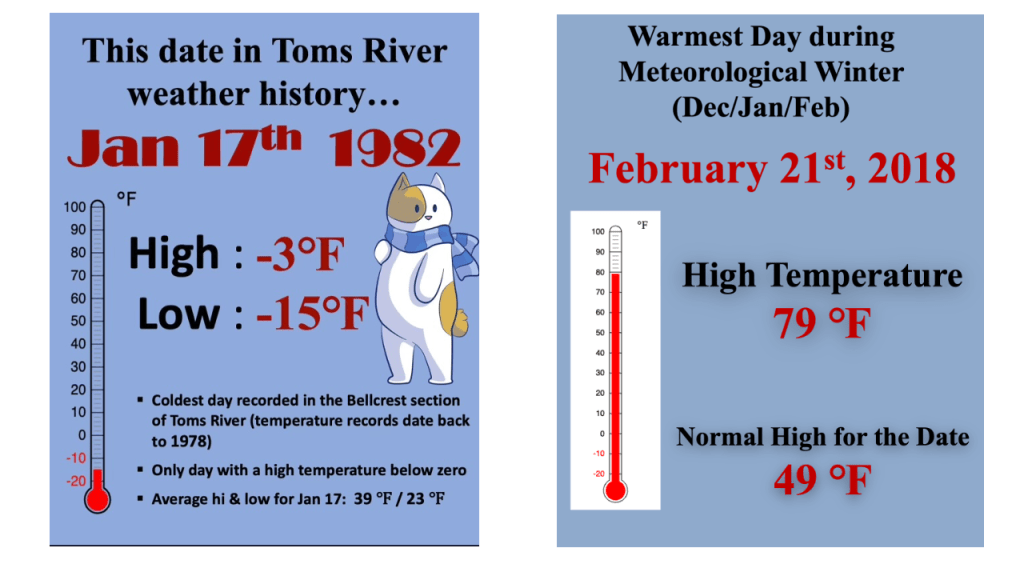
Along with the average temperatures and the spread seen in them, the highest and lowest temperatures experienced during winter have large differences. Easily the coldest period in winter was January 17th/18th of 1982, when an arctic blast brought temperatures well below zero to Toms River. The -15 degrees F recorded on each of these days represent the coldest low temperatures on record, and the high temperature of -3 degrees F on the 17th was the only time temperatures failed to break zero degrees F during the daylight hours.
The warmest day on record for winter is the 79 degrees F, which occurred on the afternoon of February 21st 2018. That airmass was so warm that it produced the third warmest winter high temperature as well, 77 degrees F, which happened the day before.
Rainfall
Precipitation records extend back to 1989, when we obtained our first 8 inch rain gauge, which required a manual measurement each day. Between 1989 and 1997, snowfall was melted to determine its liquid equivalent, and logged as rainfall. After 1997 (when rainfall recording was automated), the liquid equivalent for all snowfall was estimated by evaluating nearby observations, since there was not an observer available to melt down the snowfall. Since the only precipitation we could record directly was daily rainfall, that is the quantity analyzed, knowing that the estimation of snowmelt does have some impact on the overall accuracy of the rainfall amounts.
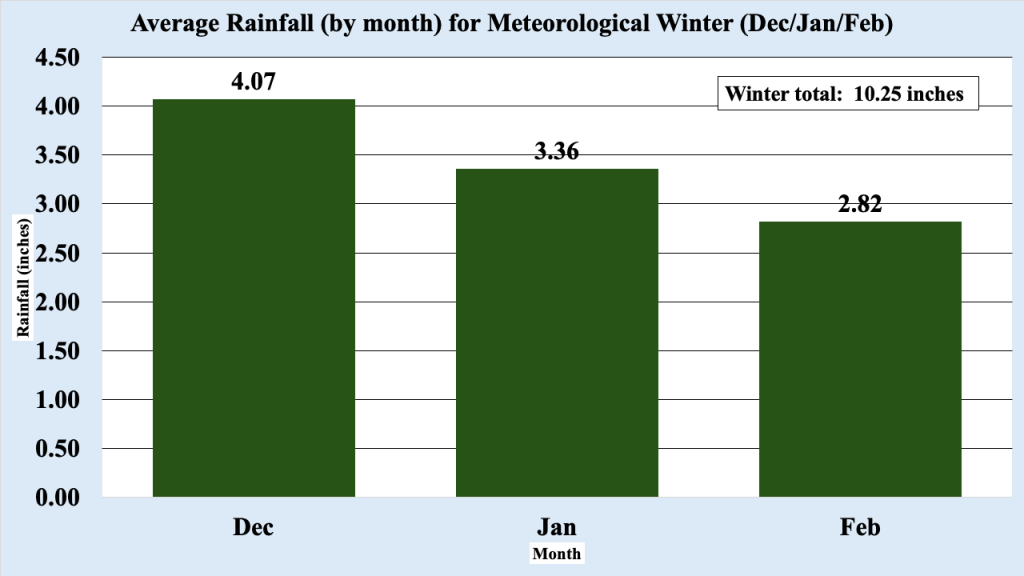
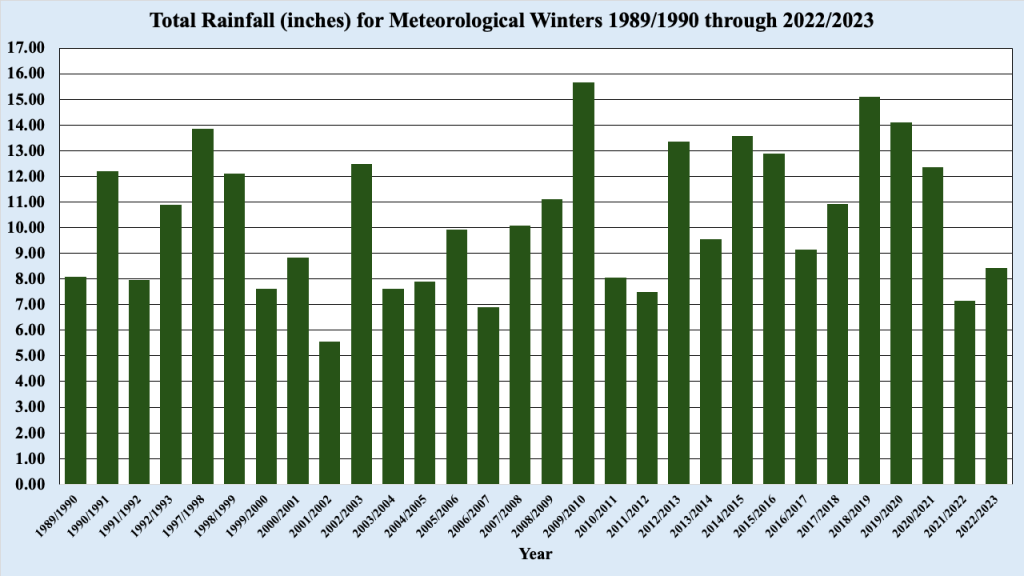
A typical winter produces just over 10 inches of rainfall (which includes snowmelt), with the highest average amounts occurring in December, and the lowest in February. Generally, colder air supports less moisture than warmer air, which explains why the colder months of winter typically have less rainfall. Of course, depending on temperature and storm track, rainfall amounts for the winter months can varying almost as much as average temperatures. Figure 6 shows a plot of winter rainfall for each year included in the analysis. The average total rainfall for winter is 10.25 inches, but only 20 percent of winters have total rainfall amounts near that mark. Just like average temperature, average total rainfall does not have much meaning, and the variability seen in the total rainfall indicates several factors could be affecting rainfall from winter to winter.
Storm Tracks
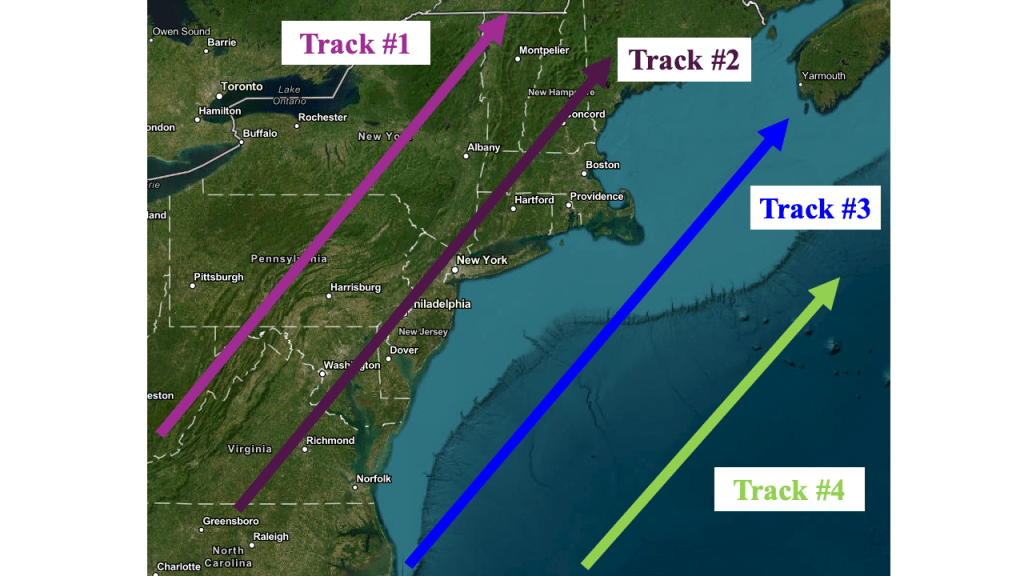
During the winter months, there are generally four storm tracks that affect the New Jersey shore. Each track has profound effects not only the amount of rainfall in Toms River, it has a large impact concerning the precipitation type. The track of the storm is the single largest factor when determining rain versus snow, and as a student of weather for much of my life, recognizing the difference in the tracks either buoyed or dashed my hopes for a big snowstorm.
Track #1
The first track brings the surface low responsible for the precipitation the Jersey Shore well to our west, tracking across central PA into northern New England. If conditions were dry and cold at the very start of the precipitation, it could begin as a brief period of snow. However, surface winds backing to the southeast brings milder air into NJ, resulting a rain event. This track is probably the worst track for snow lovers in NJ.
track #2
Track #2 takes the surface low from southern VA (where energy is often transferred from a weakening surface low over the Ohio Valley to a new surface low) across the DC metro area and just north of Philadelphia into ME. Cold air in place allows precipitation across the Jersey shore to begin as snow, and a few inches of snow is possible before winds back to the east and southeast, bringing milder air in from the ocean and gradually changing the snow to rain. Occasionally heavy snow falls just ahead of the changeover, and a younger version of myself would become excited at the prospect of heavy snow, then saddened that the snow changed to rain at the height of the storm.
track #3
Referred to as the “dream track”, surface low pressure developing off the NC coast deepens as it tracks southeast of the NJ coast before heading to western Nova Scotia. In this scenario, cold air is fed southward to the Jersey Shore from Quebec, ensuring that the precipitation remains all snow. Most of the biggest snowstorms that the Jersey Shore have taken this route, but this track is often the most difficult to maintain, since the track needs to be close enough to allow moisture to be thrown, but far enough away to keep the milder ocean air offshore. While these storms have large societal impacts on the Jersey Shore, they are fairly rare, occurring once every few years.
track #4
Track #4 is the furthest offshore, mainly because the cold air is entrenched, pushing the storm track much further away from the Jersey Shore. Typically a storm track follows what is called a thermal gradient. Simply put, a thermal gradient is a boundary where temperatures change significantly in a small area (i.e., where cold air and warm air are basically side by side), and storms track along this boundary.
In the case of track #4, the thermal gradient is often too far east or southeast of the Jersey Shore to allow moisture to be sent back to the coast. With this track, Toms River either receives very light snow, or no snow at all.
Review
While there are average temperatures and expected amounts of rainfall during the meteorological winter (defined as December/January/February), a multi year analysis shows there are often large differences in both. These differences indicate that winters in the Bellcrest section of Toms River, NJ can bring large variations. The reasons for the variations are beyond the scope of this analysis, and cannot easily be quantified with the data shown.

Leave a comment